


Per Acre Net Cash Return to U.S. Corn and Soybeans since 1975: Part I
Background
Yields become the talk at harvest, but net return determines who farms in 20 years. This article therefore examines the U.S. Department of Agriculture (USDA), Economic Research Service (ERS) data set on cost and return to production of U.S. corn and soybeans. Net cash return per acre is found to have grown on average during each of three different periods: 1975-1995, 1996-2006, and 2007-2014. Annual percent change in net cash return is found to be less variable for soybeans than corn, and during 2007-2014 than earlier periods. Adding soybeans to corn notably reduced annual variation in per acre net cash return.
Data and Analysis
This study uses the “Commodity Cost and Return” data set compiled by USDA, ERS for selected crops and livestock. The data begin with the 1975 crop year; it is available here. Corn and soybeans are examined in this study. Gross return is calculated using harvest time price and does not include payments by government programs. Costs are measured for variable inputs, overhead expenses, and fixed inputs. A major change in methodology occurred in the late 1990s resulting in comparison issues for various cost measures. Net cash return is examined. Cash costs were calculated and reported prior to the change in methodology. Since the change, which was implemented with the 1996 crop of corn and 1997 crop of soybeans; cash costs are calculated by adding to operating costs, the cost categories of hired labor, taxes and insurance, and general farm overhead. Costs not included in this study are opportunity cost of unpaid labor, opportunity cost of land (rental value), and capital recovery of machinery and equipment.
Net cash return, excluding government program payments, are calculated for three distinct periods: 1975-1995, 1996-2006, and 2007-2014. During 1975-1995, crop prices were relatively stable and farm programs included annual acreage set asides and public stocks. The 1996 farm bill eliminated these two programs. The 1996-2006 period is characterized by relatively stable crop prices and farm programs centered on fixed direct payments and countercyclical price payments. During 2007-2014, extended farm prosperity resulted from the growth in biofuel demand, growth in food demand around the world, especially China, and production shortfalls that occurred in key production areas in different years.
Net Cash Return
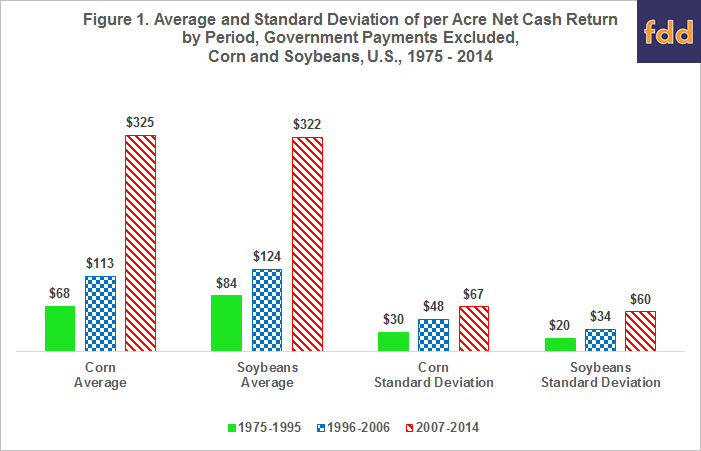
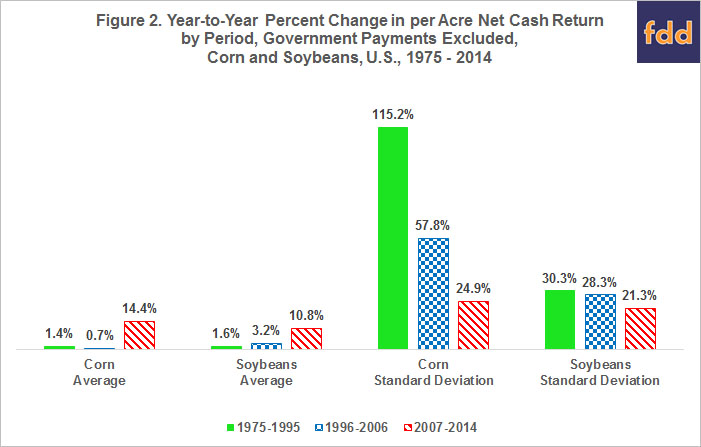
Average per acre net cash return, excluding government payments, was positive in all three periods for corn and soybeans (see Figure 1). It was higher for soybeans than corn in the first two period and nearly the same during 2007-2014. Standard deviation of per acre net cash return was higher for corn than soybeans in all three period. Per acre net cash return, excluding government payments, grew on average in all three periods (see Figure 2). Unsurprisingly, the strongest growth has been since 2006 when it was double digits for both corn and soybeans. Standard deviation of the annual percent change in per acre net cash return was also smaller in the more recent period, especially relative to 1975-1995 and especially for corn. The high variability for 1975-1995 largely results from the policy decision in the 1985 farm bill to allow prices to become market oriented. Removing 1986 and 1987 from the data set reduces the standard deviation for 1975-1995 to 42% for corn and 32% for soybeans, which are similar to the standard deviations for 1996-2006. Large changes occurred in 1986 and 1987 because farm programs had previously put a floor under price and thus net returns. This situation illustrates that government programs can postpone adjustments to large changes in market situations for only a limited time until public costs become so large that adjustments are made. The result can be even larger variability when policy finally adjusts.
Impact of Corn-Soybean Rotation on Net Return Variability
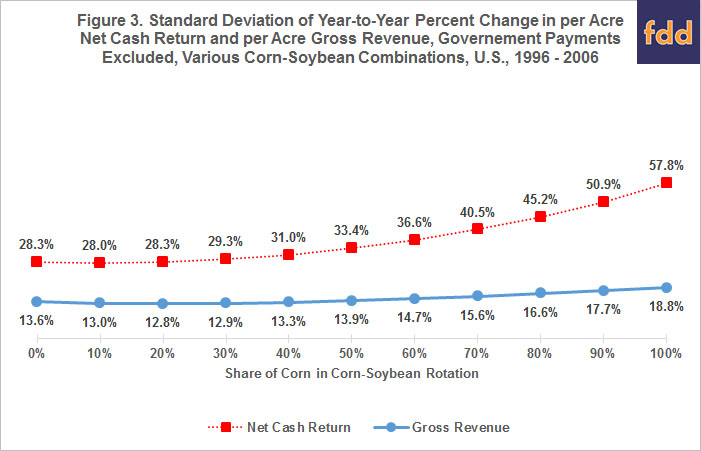
From the perspective of the U.S. as a whole, the last 50 years can be characterized as one in which soybeans have been added to corn in farm rotations. The result has been a sharp drop in the annual variability of net cash return, excluding government payments (see Figure 3). Constraining the analysis to the 1996-2006 period to avoid the high variability of corn net returns around the 1985 farm bill and the period of extended crop prosperity, planting 50% of acres to corn and soybeans, a common rotation, instead of all acres to corn reduced the annual variability in per acre net cash income to 33.4% from 57.8%. Figure 3 also illustrates the higher variability of net cash return than gross revenue, especially for corn.
Ratio of Net Cash Return to Gross Revenue by Period
An important financial benchmark is the ratio of net cash return to gross revenue. It tracks how much gross revenue is retained as cash by the enterprise. This metric increased each period (see Figure 4), probably no surprise. But, equally notable is how low the standard deviation of this ratio was in the 2007-2014 period versus the earlier periods, especially for soybeans.

Summary Observations
The above analysis and discussion prompts the following observations, suggestions for future studies, and implications.
- Farm program payments have been larger for corn than soybeans. They explain some, maybe a lot, of the differences noted in this article between corn and soybeans. However, annual acreage set asides in corn prior to 1996 represented a non-trivial cost of being in farm programs, as income was foregone on the set aside acres. Thus, the net impact of farm program payments may be more nuanced than one might initially think. Future research will look at this issue.
- The post-2006 period of crop prosperity has been one in which net cash returns were not only high but varied little by historical standards. The latter point has not received enough attention. It is not just the level but the variation that causes farmers to bid net returns into capital inputs and land. It is important going forward to monitor the variability as well as level of net cash returns.
- The stabilizing influence of the corn-soybean rotation on net cash return is sizable at the U.S. market level. This financial impact may be a key reason for the importance of corn-soybean rotations. More analysis is needed to assess how the corn-soybean rotation compares with other rotations on financial variability.
- The U.S. averages reported in this article provide farmers with national benchmarks on several key metrics, including ratio of net cash return to gross revenue and annual growth in net cash return. Farms that beat these national benchmarks have a greater likelihood of not only surviving the next 20 years but also of becoming larger operations. Forecasting the future is risky business, but the author would suggest that the 1996-2007 period may be more representative of the future than the 2007-2014 period. If this conjecture is correct, national benchmarks for the growth in corn and soybean per acre net cash return of 0.5% to 3% per year and a ratio of net cash return to gross revenue for corn and soybeans of 35% to 50% would appear to be reasonable starting points for national benchmarks. The only constant among farmers is their love of remaining in farming. A first step to achieving this goal is to understand market-wide benchmarks.
This publication is also available at http://ohioagmanager.osu.edu
Disclaimer: We request all readers, electronic media and others follow our citation guidelines when re-posting articles from farmdoc daily. Guidelines are available here. The farmdoc daily website falls under University of Illinois copyright and intellectual property rights. For a detailed statement, please see the University of Illinois Copyright Information and Policies here.