


County-Farm Loss Basis: Evidence from Illinois and Kansas Farm Management Data
Introduction
Area insurance, including county insurance, is championed, particularly by economists, for several reasons including lower administrative cost and a lower potential for cheating. However, payments by area insurance can cover more or less than a farm’s loss. This so-called area-farm loss basis risk has emerged as a topic of interest. Basis risk is usually examined for a single or only a few years due to availability of data. This study takes a longer term perspective. A long term perspective is desirable because it allows over and under coverage for a given year to be averaged over time. In this study, each farm has reported complete data including yield for the same crop in all or all but one year from 1973 through 2012 to farm management programs in the important crop production states of Illinois and Kansas. Even over 35 years, the county-farm loss basis is found to vary widely across the farm observations. This study also finds that caution is in order when using the county-farm correlation to decide between county and individual farm insurance.
Data and Procedures
Data are available for 185 farm observations as follows: corn in Illinois, 61 farms; soybeans in Illinois, 61 farms; soybeans in Kansas, 28 farms; and wheat in Kansas, 35 farms. Other state-crop combinations have fewer than 20 farm observations, which is questionable for statistical inferences. Revenue per acre at harvest is calculated as the price during the insurance harvest discovery period times the farm or county yield per planted acre during the same crop year (see data notes 1 and 2). Revenue per acre expected prior to planting for the crop year is calculated as the insurance price during the pre-plant price discovery period times the Olympic average of the farm’s or county’s plant yields for the 5 prior crop years (see data notes 3, 4, and 5). Percent change in revenue is then calculated: [(harvest revenue minus pre-plant expected revenue) divided by pre-plant expected revenue]. Insurance prices are from the U.S. Department of Agriculture (USDA), Risk Management Agency and a data set compiled by Art Barnaby of Kansas State University. County yields are calculated using data from USDA, National Agricultural Statistical Service. The farm loss profile for the 185 farm observations in this study is discussed in a July 13, 2016 farmdoc daily article.
County vs. Farm Loss Profile
Losses greater than 10% are discussed since 10% is the smallest U.S. county insurance deductible (see data note 6). Over the 1978-2012 analysis period, cumulative county losses greater than 10% expressed as a ratio to cumulative farm losses greater than 10% range from an average of 70% for Illinois soybean farms to an average of 81%-83% for the other 3 state-crop combinations (see Figure 1). In other words, using the average Illinois soybean farm as an example, over 35 crop years payments tied to county losses greater than 10% would have covered 70% of farm losses greater than 10%. The average county coverage ratio for a farm is also the farm’s average county-farm loss basis over the 35 years in the analysis period.

An average county-farm loss basis of less than 100% is expected. The primary reason is that county yield usually varies less than the yield of an individual farm in the county. A county has more acres spread over more varied agro-environments than does a single farm in the county.
The smallest county-farm loss basis is 18% for soybeans on an Illinois farm (see Figure 2). The highest is 168% for soybeans on another Illinois farm. The county loss basis is less than 50% for 20 farm observations but exceeds 100% for 26 farm observations (see data note 7). Thus, the county-farm loss basis varies substantially across farms, even when the basis is averaged across 35 years.

The county-farm loss basis varies more for the Illinois than Kansas crops. However, more extensive data are needed to determine if this finding is a characteristic of the county-farm loss basis in Illinois vs. Kansas or whether it reflects having more Illinois farm observations in this study (see data note 8).
County-Farm Correlation
A common observation is that county insurance is more useful when farm and county variability are highly correlated (that is, highly related). To examine this observation in the context of this study, a county-farm correlation is calculated using the percent deviations of harvest from pre-plant revenue for a farm and its county. The county-farm correlation ranges from +0.41 to +0.96, with an average of +0.80 (see Figure 3). Eighty three percent of the correlations exceed +0.70 (perfect positive correlation is +1.00). The averages for Illinois and Kansas are +0.80 and +0.81. Thus, the percent deviation of farm revenue over the growing season is highly related to the percent deviation of county revenue over the growing season for most farm observations in this study.
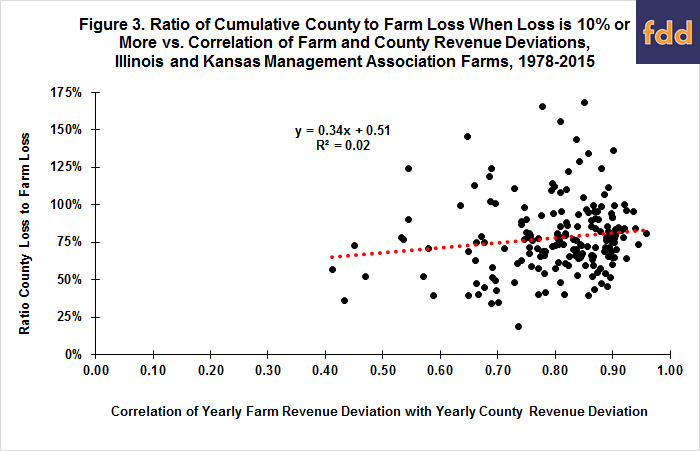
The county-farm correlation is related to the county-farm loss basis at the 95% statistical confidence level, but the correlation explains only 2% of the variation in the county-farm loss basis across farms (see Figure 3). Adding variables that allow identification of the smaller average loss basis for Illinois soybeans improves the share explained, but only to 7% (see data note 9). Thus, as a single variable, the correlation between variation in county and farm revenue over the growing season is found to have limited value in explaining the average share of a farm’s loss over the growing season covered by county loss over the growing season even when the losses are averaged across 35 years.
Summary Observations
- Before presenting the summary observations, it is important to note that growing season loss is likely to be smaller for the farms in this study because they have survived as farms since 1973. It is difficult if not impossible to determine the impact that this bias has on the findings of this analysis, but it should be keep in mind when assessing the analysis.
- Large variation is found to exist across farms in their county-farm loss basis, even when the basis is averaged over 35 years.
- A farm’s county-farm loss basis is also the share of a fam’s loss over the growing season that on average is covered by the loss its county experiences over the growing season.
- The potential for a low loss basis or coverage level is likely a key reason use of county insurance products is limited in the U.S. even though a multiplier is used to attempt to adjust for the lower average payout of county insurance.
- The preceding point can be recast as follows: a fixed, standardized multiplier in county insurance still results in a wide variation in the coverage of farm loss by its county, even when averaged over 35 years.
- The large variation in long-term county-farm loss basis raises an important policy question relative to county, more broadly area, insurance, “Is it fair that publically-subsidized area insurance could determine which farms survive and flourish simply based on a farm’s loss basis with its area?”
- The correlation between the variation of farm revenue and the variation of its county revenue over the growing season is found to have limited ability as a single variable to explain county coverage of individual farm loss over the growing season even when averaged over 35 years. Caution is thus urged when using the farm-county correlation to decide between county and farm insurance.
- The average county-farm loss basis is found to be larger for the Kansas farm observations. This finding is not consistent with the common assertion that the larger size of counties in the plain states makes county-based programs less effective for them. Counties in Kansas are on average 38% larger than counties in Illinois (794 vs. 568 square miles). Factors other than county size are also likely to influence a farm’s average loss basis with its county. For example, while extreme weather may occur more frequently in Kansas, its impact may also be more uniform due to other features of the production environment, such as a more uniform capacity of soil to hold water. In short, the size of county argument seems too convenient of an explanation for a far richer story.
The authors thank the Illinois Farm Business Farm Management (FBFM) program and Kansas Farm Management Association (KFMA) for the farm level data used in this analysis.
References
Art Barnaby, Kansas State University, Personal Communication.
Hill, R.V., M. Robles, and F. Ceballos, 2016. "Demand for a Simple Weather Insurance Product in India: Theory and Evidence." American Journal of Agricultural Economics. Advanced access.
Miranda, M.J. 1991. "Area-Yield Crop Insurance Reconsidered." American Journal of Agricultural Economics 73:233-42.
U.S. Department of Agriculture, National Agricultural Statistics Service. QuickStats. June 2016. http://quickstats.nass.usda.gov/
U.S. Department of Agriculture, Risk Management Agency. Summary of Business. June 2016. http://www.rma.usda.gov/.
Zulauf, C., J. Lim, S.-H. Kim, V. Demircan, G. Schnitkey, K. Herbel, and A. Barnaby. "Growing Season Crop Losses since 1978 on the Same Illinois and Kansas Farms." farmdoc daily (6):131, Department of Agricultural and Consumer Economics, University of Illinois at Urbana-Champaign, July 13, 2016.
Data Notes
- Crop insurance prices were collected for the state-crop combination.
- Soybean and wheat yields for a county equal county production divided by acres planted to the crop in the county. Corn yield for a county equals county production divided by acres planted to corn in the county minus any acres reported as harvested for silage in the county.
- An Olympic average removes the low and high values before calculating the average.
- Because a 5 year Olympic average is used to measure projected yield, a loss cannot be calculated for the first 5 observation years, 1973-1977. Hence, the number of observations is 35, not 40.
- Findings are similar when projected yield is measured as a trend yield for the crop year based on a linear regression of planted yields between 1973 and 2012.
- The findings are similar for other examined loss thresholds: 0%, 15%, and 20%.
- The farm observations that have a county-farm loss basis greater than 100% are almost evenly split between the two states: 14 in Illinois and 12 in Kansas. In contrast, all but 2 of the 20 farm observations that have a county-farm loss basis less than 50% are in Illinois.
- The results for the county-farm loss basis are similar whether loss is measured in yield or revenue.
- Statistical confidence for this relationship is 99%.
Disclaimer: We request all readers, electronic media and others follow our citation guidelines when re-posting articles from farmdoc daily. Guidelines are available here. The farmdoc daily website falls under University of Illinois copyright and intellectual property rights. For a detailed statement, please see the University of Illinois Copyright Information and Policies here.