


Understanding the Relationship between Loss Ratios and Crop Insurance Subsidies
The purpose of this article is to document the relationship between actual subsidy rates and loss ratios in crop insurance products, and to provide implications for policy initiatives that are being discussed related to changing subsidy rates on specific insurance products.
Federally sponsored crop insurance programs have grown dramatically through time to the point that they cover the majority of the commercially grown crops in the US with total annual premiums around $18 billion and liability around $180 billion/year. Crop insurance is broadly regarded as the primary risk management program for crop producers, and participation is likewise high with individual revenue and yield policies covering about 87% of total corn, soybeans, and wheat acres – the largest three crops by value of production in the program.
Features of the crop insurance program include a Congressional mandate to set premiums that result in a long-run break even performance, including a reasonable reserve. This means that the total indemnity payments – or the amount paid out in claims for crop losses – should equal the total premiums collected through time (7 U.S.C. §1506). To encourage participation in crop insurance and to avoid problems related to rating individuals with varying degrees of accuracy, the Federal Crop Insurance Corporation (FCIC) subsidizes premiums and also stands behind a portion of any losses/gains to the Approved Insurance Providers (AIPs) through required participation of companies in the Standard Reinsurance Agreement (SRA). Premium subsidy rates vary by unit design and coverage level based on both policy goals and insurance type. The policy intent and justification for premium subsidy is that if there is broad enough participation in crop insurance, then there would not be a need for ad hoc disaster payments which in turn are typically less targeted and can be more costly than insurance payments that are tied to actual individual losses.

The ratio of indemnity payments to premiums collected is termed the loss ratio. If the loss ratio or indemnity/premium = 1.0 on average through time, then the program is considered to be actuarially fair as is mandated by the statute. Historical performance of the entire crop insurance program indicates that this mandate is being met at the program level: the overall loss ratio for the entire program (all policies and areas) from 2011 to 2022 has been 0.87, but varies widely across crops and policy types. Other basic facts and assumptions to illustrate the workings of the crop insurance program, including various ways to express the relationships among premiums, liabilities and indemnities are:
- For any given insurance policy, the premium rate = premium/liability.
- Loss rate = indemnity/liability. This fraction would also equal the premium rate on average through time if the policy is accurately rated and no other loadings or reserves exist.
- Completing the identity, the premium rate * liability = premium. The premium is stated in dollars (not a fraction) and is necessarily proportional to the potential size and likelihood of losses (i.e. the value being insured and the amount of risk involved).
- Higher deductible policies (lower coverage levels) should cost less, and lower deductible policies (higher coverage) should cost more, all else equal.
- The subsidy rate schedule of the share of the premium that the federal government pays is set by congressional policy. The farmer pays (1-subsidy rate)*premium as their out-of-pocket cost for insurance.
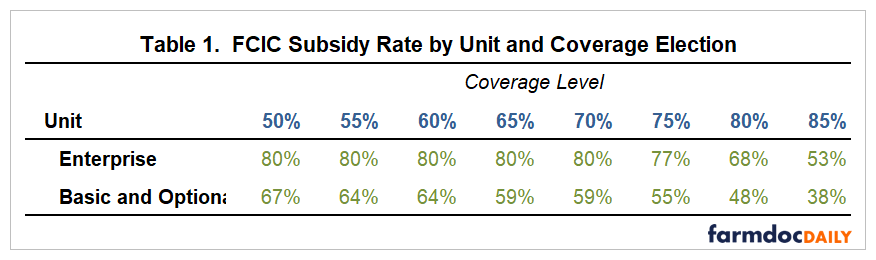
The table below shows the stated FCIC subsidy rates by unit and coverage level for individual yield and revenue products. In general, stated subsidy rates decline as the producer-elected coverage level increases and the farmer pays a higher share of the cost of the policy. For example, the producer-paid portion in the case of a basic unit 85% Revenue Protection policy would be 62% of the premium and the government would pay 38% of the premium.
As the Farm Bill debate advances, several proposals to modify the subsidy rates associated with various products and coverage levels have been proposed to promote producer participation in specific products, regions, or cases. One example proposal to modify the subsidy rates associated with various products and coverage levels was reviewed previously (see e.g., farmdoc daily, June 27, 2023).
Proponents of crop insurance generally look for ways to create higher effective coverage and lower effective costs, while opponents often cite high subsidy rates and program costs as a drawback to the policy designs. Both sides often use the term “subsidy rate” to compare costs across different coverage levels, and across crops, and for different regions in assertions of the value of insurance and relative effectiveness. However, accurate characterization of effective subsidy is required before discussing the implications of changing subsidy rates or capping premium costs; because it is an insurance program, premium costs should vary in actuality based on their actuarial implications. Importantly, to do so requires a deeper understanding of the performance of the associated underlying crop insurance policy and its impact on the effective, or realized, subsidy rate.
In simplest form, the stated subsidy rates are only accurate if the loss ratio is equal to 1.0. If insurance is overpriced and the resulting loss ratio is therefore less than 1.0, then part of the subsidy is “used up” by the mis-rating. If insurance is underpriced and the loss ratio is greater than 1.0, then the effective subsidy rate is amplified by the excess payments relative to the premiums collected.
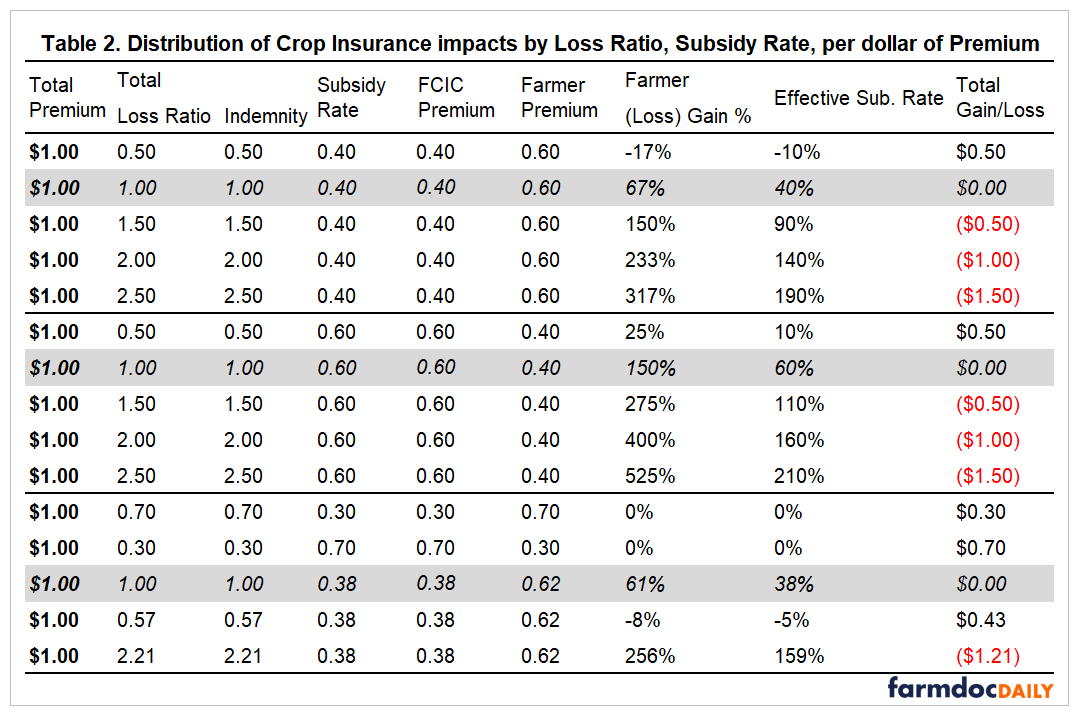
To better understand the impact of loss rates on effective subsidy, consider the following table of cases showing the distribution of Crop Insurance costs and payments across various loss ratios and subsidy rates. For simplicity, these are presented per dollar of premium, but the results scale by premium directly with loss ratios. The table is presented in three panels from top to bottom and a later tabulation generalizes these results further.
In the top third of the table, the subsidy rate of 40% is unchanged across loss ratio cases from .5 to 2.5 which represents reasonable ranges of actual performance within the current program. The indemnity (or equivalently the insurance payment) and loss ratio are two ways to show the same thing as is especially clear when expressed per dollar of premium. The splits between FCIC and farmer premiums are in the next two columns followed by the farmer’s gain (loss) rate as a share of the farmer premium. In the first row, for example, the farmer paid $.60 and received $.50 resulting in a 17% loss rate or a -17% rate of return on the farmer-paid premium.
The effective premium subsidy rate is critical to fully understand as it is the fraction of the total premium provided to the farmer for participating in crop insurance. Again, much of the narrative around crop insurance assumes that the stated rate is effectively a transfer to the farmer, but this depends critically on other features of the program. In the first row, the effective subsidy rate is simply ($.50-$.60)/$1.0 or -10% which is simply the share of the total premium the farmer gained or lost. In the second row of the table, the effective premium subsidy is 40% and is equal to the stated subsidy rate because the loss ratio is exactly 1.0 as mandated for overall performance of the program. In other words, the effective premium subsidy rate = (indemnity – farmer premium)/total premium will equal the premium subsidy rate if and only if the loss ratio is 1.0.
The shaded row in each panel shows that equivalence across other combinations of input cases. The final column shows the total gain or loss that occurs in each case simply as the total difference between the indemnity payment and premium. If the loss ratio is 1.0, then the effective and stated subsidy rates are identical, and the total program gain or loss equals 0 as mandated.
Importantly though, loss ratios are not always near 1, but instead vary by crop, period, coverage level and unit designation. To begin to develop a sense of the relationships, the middle panel of the table repeats the patterns of the first panel but with a stated subsidy rate of 60%. The “leverage” in term of scaling of the rates of gain and of the effective subsidy are apparent by comparison as higher loss rates result in higher effective rates of gain on the farmer-paid premium portion.
The third panel in the table varies the loss ratios and subsidy rates to demonstrate some key features that must be included when considering the impacts of different subsidy rates. In the first two rows, the subsidy rate and the loss ratio sum to 1 resulting in no gain or loss to the farmer even through the premium structure resulted in gains to the insurance provider of $.30 and $.70 in the first two cases. In both cases, the “subsidy” is effectively used up by the overrating in the policy, or the amount overcharged relative to the actual payment level. The last two rows in the table show low loss rate and high loss rate cases in which, after 38% subsidy that would be typical of an 85% RP policy, result in effective subsidy rates from -5% to +159%. These are cases that are in fact typical and help to illustrate why conversations about subsidy rates only, absent an understanding of the rating accuracy, make no particular sense to use to evaluate policy options.
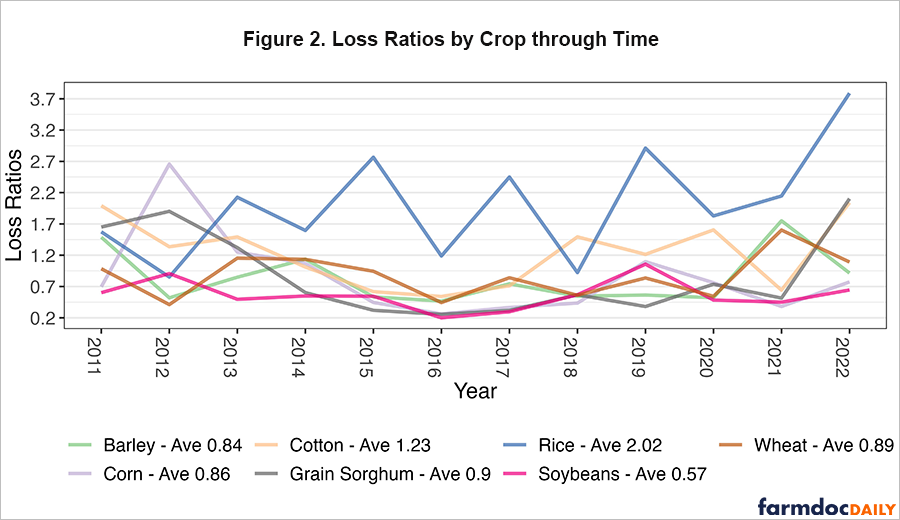
Because “subsidy rate” only corresponds to a program level subsidy rate if loss ratios are 1.0, it is also reasonable to assess the actual crop insurance loss performance by crop, region, coverage level, unit choice and so on both for selecting insurance and in evaluating its long-term performance. Figure 2 below shows the total loss ratios through time by crop aggregated across all policies and coverage levels in the shares actually used through time (for more detail also see e.g., farmdoc daily, January 17, 2023). Interestingly, soybeans have had very low loss experience and thus provide less effective subsidy than the stated subsidy schedule. Of course, capturing effective subsidy is not at all the primary motivation for a farmer to use crop insurance as the downside risk protection is clearly the important feature. However, it would be reasonable for farmers to adjust their participation in response to the performance of crop insurance through time based on the long-term economics of the program.
In practice, it would seem to be a better objective to work toward more accuracy in rating to achieve participation objectives rather than to alter subsidy rates or try to use extremely high subsidy rates to attract participation into lower loss rate products. Moreover, higher loss-rate situations already experience subsidy rates in excess of the stated rates, and thus it is important to understand the relationship between loss experience and subsidy rate before adjusting either premiums or subsidies.
In summary, crop insurance remains the most critical risk management program for farmers, and subsidy level issues are clearly not the primary motivation for most farmers in selecting policies. Nonetheless, it is still important to recognize that stated subsidy rates do not serve as fully accurate measures of actual subsidy when loss ratios depart from 1.0, and policy considerations need to take all aspects of crop insurance performance into account. Where loss ratios are higher than 1.0, subsidy rates are higher than stated, and where loss ratios are lower than 1.0, subsidies are lower than mandated. Where imbalances occur and persist over time, those issues challenge the integrity of the crop insurance program and the fairness for farmers who have to make annual purchase and risk management decisions. These are matters to be explored further.
References
Schnitkey, G., B. Sherrick, N. Paulson, C. Zulauf, J. Coppess and J. Baltz. "Premium Support and Crop Insurance: An Analysis of the Proposed 4% Farmer-Premium Payment Cap." farmdoc daily (13):117, Department of Agricultural and Consumer Economics, University of Illinois at Urbana-Champaign, June 27, 2023.
Schnitkey, G., C. Zulauf, N. Paulson and J. Baltz. "Crop Insurance for Soybeans: The Low Loss Ratio Concern." farmdoc daily (13):8, Department of Agricultural and Consumer Economics, University of Illinois at Urbana-Champaign, January 17, 2023.
Disclaimer: We request all readers, electronic media and others follow our citation guidelines when re-posting articles from farmdoc daily. Guidelines are available here. The farmdoc daily website falls under University of Illinois copyright and intellectual property rights. For a detailed statement, please see the University of Illinois Copyright Information and Policies here.