Vendor Finance in the Northeast Dairy Industry
The previous articles in this series (farmdoc daily, March 18, 2020; March 25, 2020) have highlighted the current landscape of nontraditional lenders in agricultural credit markets and provided estimates of the magnitude of credit held in the category. Nontraditional lenders serve a wide swath of agricultural borrowers; however, the volume of credit held in vendor financing and by collateral-based lenders is likely influenced by financial stress. Many of these nontraditional lenders are closely held private companies that are not subject to public financial disclosures, adding complexity to understanding their role. In this study, we present results of a novel survey of northeastern feed manufacturers that demonstrates how financial stress can be a key driver of vendor financing.
Trade Credit Background
One type of nontraditional finance is vendor financing, or trade credit, which is credit offered to customers by suppliers of inputs, equipment, and so on. Traditionally, it involves only the supplier offering credit terms and the customer who chooses to utilize the terms. Unlike the relatively new services, including background vendor financing provided by John Deere Financial and Rabo AgriFinance, trade credit is a historic norm in the agricultural industry. We have assessed the use of trade credit in the Northeast dairy industry from 2014 to 2018 using both feed manufacturer data and farm survey data. This period coincides with the milk price boom of 2014 and the historically lengthy milk price depression of 2015–2018.
Feed Manufacturer Survey
We were assisted by a regional trade group, the Northeast Agribusiness and Feed Alliance, in the design of our survey. They advised on the best way to collect the information while using common accounting practices within the feed manufacturing industry. We identified 29 feed manufacturing firms and contacted them via phone and email from March to November 2018. Twelve firms joined our survey and provided the following information:
- Trade credit terms offered to customers
- Annual sales
- Annual tons of feed sold
- Sales past due
- Sales past due 90 days or more
The participating firms jointly represent more than 70 percent of the total annual sales volume of dairy feed grain and dairy feed concentrates in the Northeast.[1]
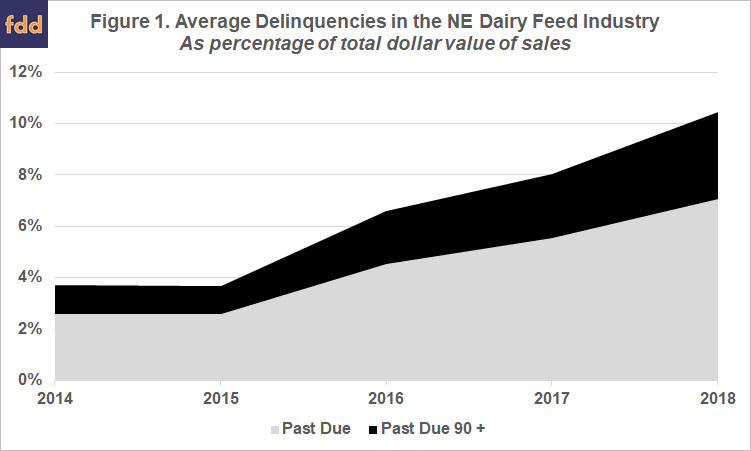
Delinquency is the total volume of past due invoices, including those invoices that are considered uncollectable. Trade credit becomes “effective credit” when an invoice persists into delinquency and implies the farm has forgone the discount period and the feed industry has become a creditor with an uncertain time horizon. Figure 1 shows the magnitude of effective credit supplied by the feed industry to the dairy industry.
A back-of-the-envelope calculation suggests the overall magnitude of effective credit provided by the feed industry was nearly $100 million in 2018.[2] We consider this a conservative estimate because some firms were not able to participate due to financial reorganization during the period and we cannot reflect firms that are no longer in business. To provide some context for the magnitude of $100 million of effective credit, a regional commercial bank with a significant ag lending portfolio in New York maintained a balance of $54 million of “loans to finance agricultural production and other loans to farmers” during 2018. The feed manufacturing industry is an important creditor to the Northeast dairy industry.
Farm-Level Analysis
We analyzed dairy farm survey data from New York to gain insight into the relationship between farm stress and the increasing balances of trade credit held by the feed industry. The Cornell Dairy Farm Business Summary (DFBS) is an annual farm-level survey of key financial and production metrics. We measure stress as the annual difference between the average All Milk[3] price and the mean operating expense per hundredweight calculated from the DFBS. The mean farm operating margin per hundredweight is detailed in Table 1 below.
Dairy farm stress is clearly related to the volume of trade credit being supplied by input suppliers. This is consistent with the historic literature showing that trade credit acts countercyclically to the business cycle for publicly traded companies Nilsen, (2002) and nonfarm small businesses Petersen and Rajan, (1997). We further look for evidence of farms that utilize trade credit at a disproportionate rate.
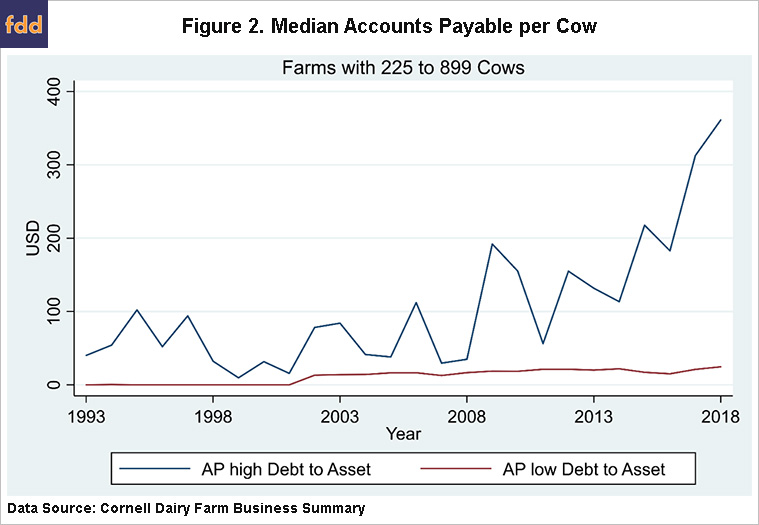
While we are unable to draw a direct link between supplier delinquencies and the dairy farm customer responsible, we can observe the use of the accounting category, accounts payable, within the DFBS to evaluate trade credit Meltzer, (1960). Maintaining a balance of current accounts payable can be expected and is optimal for strategic liquidity management; however, persistent large balances would reflect some level of delinquency. The DFBS does not delineate the portion of accounts payable, which is delinquent, therefore we make use of persistent balances to suggest delinquency. We find that more indebted[4] dairy farms maintain higher balances of accounts payable. Figure 2 below shows farms with 225 to 899 cows subdivided into two debt-to-asset ratio classes and the corresponding median balance of accounts payable. We find that more indebted farms are using accounts payable at a much higher rate, suggesting financial stress is a key driver of vendor finance in this context.
Conclusion
Northeastern dairy feed manufacturers are a meaningful creditor of the dairy industry during times of farm stress. Dairy farms utilizing this mode of credit have relatively higher debt-to-asset ratios, suggesting this credit may be riskier than previously thought. In contrast, Ifft, Kuethe, and Patrick, (2017) find no difference in financial indicators of financial stress associated with using implement dealer financing, albeit during a period of relatively low farm financial stress. Our analysis would not have been possible without substantial investment of time and resources into both the well-established Cornell Dairy Farm Business Summary and our survey of feed manufacturers. Creative use of existing information as well as novel data collection are necessary to assess the role nontraditional lenders are playing in the agricultural credit market and the riskiness of debt that cannot be observed by financial regulators and policymakers.
We welcome feedback and questions sent to jifft@cornell.edu. This research was supported in part by the USDA National Institute of Food and Agriculture, NC-1177 Multistate project, number 1016791. We are grateful for the collaboration of NEAFA and the Cornell DFBS team (Jason Karszes and Wayne Knoblauch).
References
Fiechter, C. and J. Ifft. “How Big Is Nontraditional Finance?.” farmdoc daily (10):55, Department of Agricultural and Consumer Economics, University of Illinois at Urbana-Champaign, March 25, 2020.
Fiechter, C. and J. Ifft. “What Makes Nontraditional Finance Nontraditional?.” farmdoc daily (10):50, Department of Agricultural and Consumer Economics, University of Illinois at Urbana-Champaign, March 18, 2020.
Ifft, J., T. Kuethe, and K. Patrick. “Nontraditional Lenders in the U.S. Farm Economy.” Presentation at the 2017 Agricultural and Rural Finance Markets in Transition Multistate Group Meeting, October 2-3, 2017, Minneapolis, Minnesota.
Meltzer, Allan H. (1960). Mercantile credit, monetary policy, and size of firms. The Review of Economics and Statistics: 429-437.
Nilsen, Jeffrey H. (2002). Trade credit and the bank lending channel. Journal of Money, Credit and Banking: 226-253.
Petersen, Mitchell A., and Raghuram G. Rajan (1997). Trade credit: theories and evidence. The Review of Financial Studies: 10(3) 661-691.
Notes
[1] Defined as the volume of feed sales in US dollars reported in the 2017 USDA agricultural census for CT, MA, ME, NH, NJ, NY, RI and VT. [2] Calculated as 10 percent of approximately $940 million of feed sales from the 2017 USDA Agricultural Census in CT, MA, ME, NH, NJ, NY, RI and VT. [3] A calculated annual average of “All Milk” price reported by “Livestock, Dairy, and Poultry Outlook” Economic Research Service: U.S. Department of Agriculture (2014–2018). [4] Above 0.40 debt-to-asset ratioDisclaimer: We request all readers, electronic media and others follow our citation guidelines when re-posting articles from farmdoc daily. Guidelines are available here. The farmdoc daily website falls under University of Illinois copyright and intellectual property rights. For a detailed statement, please see the University of Illinois Copyright Information and Policies here.


