


Anhydrous Ammonia Prices: Continued Increases Likely
Anhydrous ammonia prices in Illinois have been slowly increasing since the beginning of 2011. According to Agricultural Marketing Service’s first report in 2011, anhydrous ammonia prices averaged $777 per ton across Illinois. Since then, prices have increased an average of $1 per week, reaching $801 per ton at the end of June.
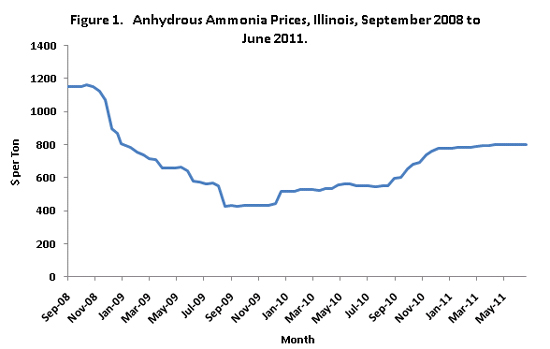
A key question is whether ammonia prices will continue this slow increase into fall 2011 or whether prices will increase at a faster rate. Which tract ammonia prices take has relatively large impacts on 2012 production costs.
Some feel of the direction of anhydrous ammonia prices can be gained by evaluating the factors that are correlated with anhydrous ammonia. Since September 2008 – the period shown in Figure 1 above – anhydrous ammonia prices have been correlated with both corn and natural gas prices. The anhydrous ammonia–corn price correlation is .68 while the anhydrous ammonia–natural gas price correlation is .58. The correlation between ammonia-corn likely indicates a demand relationship; higher corn prices indicate larger future planting of nitrogen using crops, leading to more use and higher prices of ammonia. Moreover, higher corn prices indicate a higher ability of farmers to pay for nitrogen. The correlation between ammonia-natural gas likely indicates a supply relationship; natural gas is a key input in anhydrous ammonia production, with higher natural gas prices leading to higher costs of producing ammonia.
Figure 2 illustrates correlations by showing anhydrous ammonia, corn, and natural gas prices. So as to control the scale of the graph, these prices are standardized by dividing each price series by the average for the September 2008 through March 2011 period. For example, the average anhydrous ammonia price is $669 per ton from September 2008 through March 2011. On the graph, the September 2008 price of $1,149 per ton is shown as 1.71 ($1,149 / $669 average), indicating that the $1,149 price is 71 percent above the $669 per ton average.
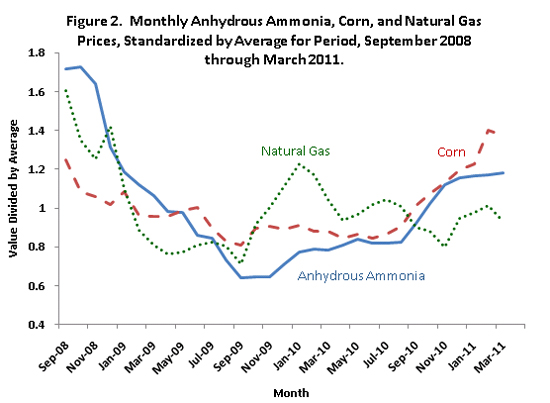
All three prices generally decreased from September 2008 through September2009 (see Figure 2). Then in December 2009 ammonia prices began increasing, following increases in natural gas prices. While natural gas prices declined in early 2010, ammonia prices did not decline. Instead anhydrous ammonia prices continued to increase, following increases in corn prices.
For fall 2011, there are few indications that natural gas prices will increases. Futures prices indicate stable natural prices through 2011. Hence, increasing natural gas prices likely will not lead to higher ammonia prices.
Corn prices, however, likely will remain at above average. These above average corn prices, indicating strong demand for nitrogen fertilizers, likely will contribute to increases in ammonia prices.
Disclaimer: We request all readers, electronic media and others follow our citation guidelines when re-posting articles from farmdoc daily. Guidelines are available here. The farmdoc daily website falls under University of Illinois copyright and intellectual property rights. For a detailed statement, please see the University of Illinois Copyright Information and Policies here.