


2012 Corn and Soybean Budgets
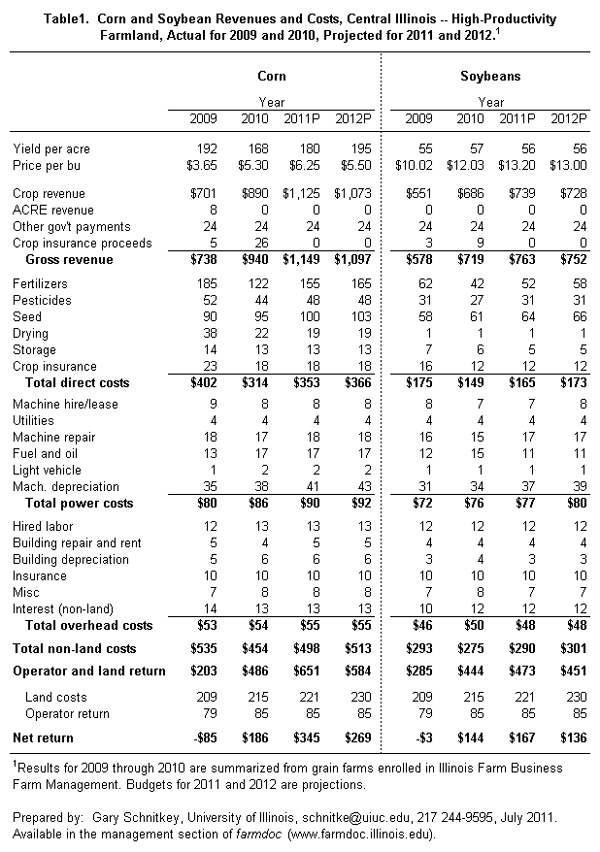
Table 1 contains 2012 corn and soybean budgets for high-productivity farmland in central Illinois. Budgets for other Illinois regions are shown in the appendix. Along with 2012 budgets, Table 1 contains actual results for 2009 and 2010, as summarized from farms enrolled in Illinois Farm Business Farm Management (FBFM). Also shown are 2011 projections. Costs in 2012 are projected to increase, leading to high break-even commodity prices. Projected 2012 commodity prices suggest that 2012 will be a profitable year. Of course, economic situation could change between now and 2012 harvest. Chicago Mercantile Exchange (CME) options contract suggest that prices resulting in very low returns are possible.
Preparation of 2011 and 2012 Budgets
Commodity prices used in 2011 and 2012 budgets are based on CME futures prices. In these budgets, a projected price equals the futures prices during the respective delivery year, minus a usual basis. Projected 2011 prices are $6.25 for corn and $13.20 for soybeans, both of which are within the range shown in the July 12th World Agricultural Supply and Demand Estimates (WASDE) report (see http://www.usda.gov/oce/commodity/wasde/). Projected 2012 prices are $5.50 for corn and $13.00 for soybeans.
Yields for 2011 and 2012 are based on trend yields. A trend yield is based on historical yields that are adjusted upward for yield increases due to technological changes. Yields have averaged a two bushel per year increase for corn and a one-half bushel increase for soybeans. Trend yields for corn are 193 for 2011 and 195 for 2012. In the budgets, the 2011 trend yield of 193 bushels is lowered to 180 bushels to because yields likely will be lower due unfavorable weather, including a wet spring and a hot, dry July. Trend yields for soybeans are 56 bushels for both 2011 and 2012. Because of less specific information about yield, the 2011 soybean yield has not been adjusted from its trend yield.
Costs for 2011 and 2012 are estimated using 2010 costs as a base. In estimating 2011 costs, input prices in 2011 are compared to 2010. If input prices are 20 percent higher in 2011, 2011 input costs are increased by 20 percent over 2010 costs. A similar process is used for 2012, with projected 2012 prices being gathered and compared to 2011 prices. Some adjustments are made to this costing process. For example, 2010 pesticide costs are lower than 2009 costs. This decline is partially due to lower pesticide prices, but also due to lower pest pressures resulting in lower pesticide applications. To more closely reflect average conditions, pesticides are adjusted up more than indicated by price changes.
Non-land Costs Continue to Rise
Non-land costs in 2012 are projected at $513 per acre for corn and $301 per acre for soybeans (see Table 1). If it occurs, the 2012 corn cost of $513 would be the second highest, with only actual costs of $535 per acre in 2009 exceeding 2012 projected costs. For soybeans, the $301 per acre non-land costs would be the highest on record.
The costs that are projected to increase the most between 2011 and 2012 are fertilizers. Corn fertilizer costs are projected to increase from $155 per acre in 2011 up to $165 per acre in 2012, a $10 per acre increase that accounts for 67 percent of the non-land cost increase between 2011 and 2012. Fertilizer costs for soybeans are projected to rise from $52 in 2011 to $58 in 2012.
Break-even Prices
Break-even prices equal non-land costs plus land costs, divided by expected yield. For corn, non-land costs of $513 per acre plus $230 of land costs results in $743 of total costs. Break-even price then equals $3.81 per bushel ($743 total costs / 195 expected yield). The $3.81 expected price indicates that commodity prices must exceed $3.81 for the farmer to have positive returns. The break-even price for soybeans is $9.48 ($301 non-land costs + $230 land costs) / 56 bushels).
The 2012 break-even prices are relatively high. They are near $4.60 per bushel for corn and $11.50 per bushel for soybeans that Good and Irwin suggest will be average price until structural returns. Moreover, Good and Irwin indicate that in some years prices be in the low $3.00 range for corn and low $8 per bushel range for soybeans will occur. Given current cost levels, these commodity prices would result in large losses to Illinois farmers.
Break-even costs will vary across farms depending on land costs. The $230 per acre is close to the projected cash rent in 2012. Higher cash rents will result in higher total costs and higher break-even prices. Higher break-even prices then signal higher risks
What about Cash Rents?
Relative to 2011, operator and farmland returns are projected lower in 2012. Operator and farmland return is projected at $651 in 2011 and $584 in 2012. Soybean returns are projected at $473 in 2011 and $451 in 2012. Given that cash rents have been set properly in 2011, 2012 returns do not suggest that cash rents should rise in 2012.
In recent years, cash rents have been increasing. Between 2006 and 2010, average cash rents in Illinois increased an average of 28 percent. These historical increases likely leads to continuing momentum for cash rent increases into 2012, even when operator and farmland returns are not projected to rise.
At some point, corn and soybean prices will fall, leading to much lower agricultural returns. At that point, cash rents will need to fall so farmers will not have losses. The stickiness of cash rents at high levels may become an issue when returns become lower
Net Returns and Price Risks
Net returns for 2012 are projected at $269 per acre for corn and $136 per acre for soybeans, indicating a profitable year.
Net return projections shown in Table 1 are dependent on commodity price levels. It goes without saying that there is price volatility, with lower price levels than those in Table 1 being possible. At this point, CME options prices suggest that there is a 25 percent chance of cash prices in the fall of 2012 being below $4.40. CME options prices suggest a 25 percent change of cash soybean prices in the fall of 2012 being below $10.25. These prices would result in much lower returns and likely cause financial stress on some farms, particularly those that have high cash rent levels.
Summary
Current projections suggest that 2012 will be a profitable year. However, cost levels are high, resulting in high levels of risk. If returns fall because of price declines, much lower returns than those shown in Table 1 will result. Options prices suggest that there are significant possibilities of prices occurring that would cause low returns.
Appendices


Disclaimer: We request all readers, electronic media and others follow our citation guidelines when re-posting articles from farmdoc daily. Guidelines are available here. The farmdoc daily website falls under University of Illinois copyright and intellectual property rights. For a detailed statement, please see the University of Illinois Copyright Information and Policies here.