


USDA Corn and Soybean Yield Forecast Errors Across Report Release Months
In an earlier post we examined the accuracy of the USDA’s August forecast of the U.S. average corn and soybean yield since 1970 to determine if there had been a change in accuracy over time. Here we examine the magnitude of the yield forecasting errors for corn and soybeans over the forecast cycle from August through November. The same time period as used in the previous analysis, 1970 through 2010, is used here. The analysis of forecast errors should be helpful in evaluating forecasts in the current forecast cycle.
The forecasting errors are summarized in Figures 1 and 2 using box-and-whisker plots. For each month, the distance from the top of the upper whisker to the bottom of the lower whisker captures the entire range of forecasting errors over the past 41 years. The upper whisker reflects the range of forecasting errors for the largest 25 percent of under-estimates of yield and the lower whisker reflects the range of forecasting errors for the largest 25 percent of over-estimates of yield. The box captures the range of errors for the middle 50 percent of the errors. In August, for example, the forecasting errors for the U.S. average corn yield ranged from an over-estimate of 18.3 percent to an under-estimate of 10.1 percent. The middle 50 percent of the errors ranged from an over-estimate of 1.3 percent to an under-estimate of 5.1 percent. The August forecasting errors for the U.S. average soybean yield ranged from an over-estimate of 16.2 percent to an under-estimate of 10.2 percent. The middle 50 percent of the errors ranged from an over-estimate of 3.0 percent to an under-estimate of 4.5 percent.

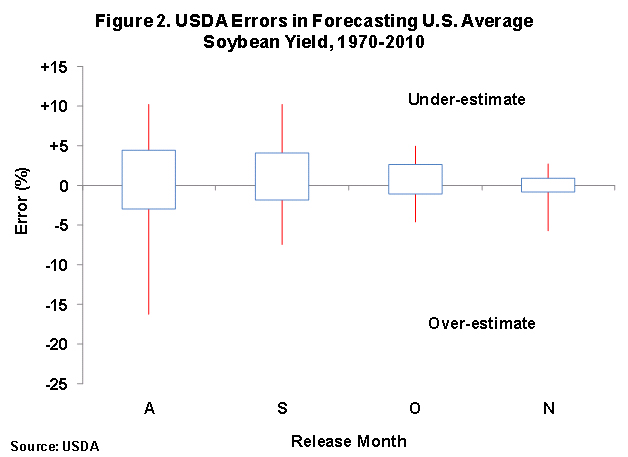
The plots show that corn and soybean forecasting errors have gotten progressively smaller with each month of the forecasting cycle. This progression is logical. As the forecasting cycle progresses, corn and soybean producers have more crop development information, including actual harvest results, on which to base their yield forecasts in responding to USDA surveys. Similarly, advancing crop development provides USDA enumerators an opportunity to collect more fruit count and fruit weight data in the Objective Yield Surveys to more accurately forecast actual yield. For a review of the USDA yield forecasting methodology, see our report of March 2011.
By October or November of most years, USDA yield forecasts are reasonably accurate and likely provide the most accurate forecasts available. In November, for example, the forecasting errors for the U.S. average corn yield ranged from an over-estimate of 2.4 percent to an under-estimate of 2.7 percent. The middle 50 percent of the errors ranged from an over-estimate of 0.7 percent to an under-estimate of 0.7 percent. The November forecasting errors for the U.S. average soybean yield ranged from an over-estimate of 5.7 percent to an under-estimate of 2.7 percent. The middle 50 percent of the errors ranged from an over-estimate of 0.8 percent to an under-estimate of 1.0 percent.
While most market participants tend to focus on the USDA’s “point” corn and soybean yield or production forecasts each month, recognition of the magnitude and pattern of forecast errors is helpful in evaluating the forecasts.
Disclaimer: We request all readers, electronic media and others follow our citation guidelines when re-posting articles from farmdoc daily. Guidelines are available here. The farmdoc daily website falls under University of Illinois copyright and intellectual property rights. For a detailed statement, please see the University of Illinois Copyright Information and Policies here.