


Projected Incomes Given Differing Commodity Prices
Net farm incomes are projected for a 1,200 grain farm given four sets of prices:
- Projected 2012 prices ($5.40 for corn, $11.60 for soybeans),
- Long-run prices ($4.50 for corn, $11.60 for soybeans),
- Low price year ($3.50 for corn, $10.50 for soybeans), and
- Poor price year ($3.00 for corn, $7.00 for soybeans).
These projections aid in evaluating risks that farmers face from price changes.
For each price scenario, incomes are projected with and without insurance. For the “with insurance” case, Revenue Protection policies with 80 percent coverage levels are used with projected prices of $5.80 per bushel for corn and $12.00 per bushel for soybeans. These projected prices are near current futures prices for 2012 harvest-time contracts. The with insurance case represents risks during the 2012 cropping year, given that projected prices are near $5.80 for corn and $12.00 for soybeans. In 2012, large price declines likely will be buffeted by higher crop insurance payments.
Without insurance represents cases in which prices have adjusted downward by the time projected prices are set so that crop insurance does not provide as high of level of price protection. In the low price scenario, for example, the projected price for corn would have adjusted so that a $3.50 corn price does not generate crop insurance payments at normal prices levels. This could occur after a large yielding year, resulting in adequate supplies and stock building, yielding low prices expectations during the crop insurance price discovery period during February.
Incomes are generated using 2012 budgets, as shown in Table 1. Budgets show returns for 2012 prices, as well as long-run prices. In income projections, two-thirds of the farmland is assumed in corn and one-third in soybeans. The farm is assumed to own 10 percent of farmland, share-rent 30 percent, and cash rent 60 percent. This land tenure represents the typical breakdown across northern and central Illinois. Cash rent is set at $275 per acre. The farm has $480,000 of debt.
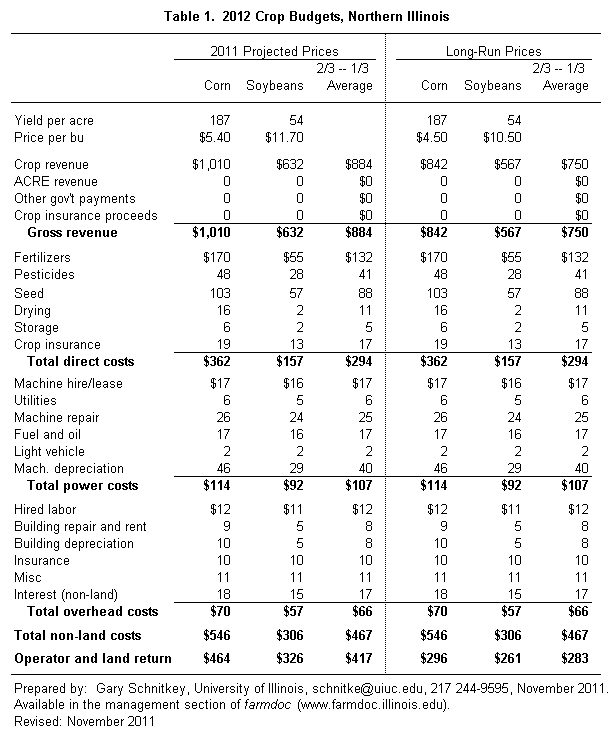
Projected Net Incomes
With projected 2012 prices of $5.40 for corn and $12.00 for soybeans, net farm income is projected at $222,100 with and without insurance (Table 2). Prices used in this scenario are near those implied by current prices of harvest-time futures contracts. These prices, along with expected yields of 187 bushels per acre for corn and 54 bushel per acre for soybeans, result in an above average income year.
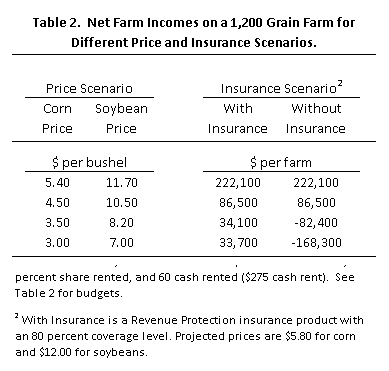
Long-run prices of $4.50 for corn and $10.50 for soybeans result in net farm income of $86,500. Long-run prices represent estimates that commodity prices will average over the next five years. Given these long-run averages, prices in 2010 and 2011 have been above the long-run average. Overall, these prices result in an income that would maintain the financial position of the farm.
The low prices scenario uses prices of $3.50 for corn and $8.20 for soybeans. These prices could easily occur in future when abundant commodity supplies exist relative to demands, leading to commodity stock building. The $3.50 corn price is near to the average corn price in 2009 of $3.53. (The $8.20 soybean price is below the $9.80 price in 2009.) With insurance, net farm income is projected at $34,100. Sizable crop insurance payments occur resulting in support for net farm income. Without insurance, net farm income is -$82,400, indicating that these “low” prices result in negative net incomes without price protection offered by crop insurance.
The poor price scenario with prices of $3.00 for corn and $7.00 for soybeans represents a case in which prices are significantly below the long-run average. Just as there has had several years of prices above the long-run average, there will be years in which prices are significantly below average. These poor prices results in a $33,700 net farm income with crop insurance. Net farm incomes in the poor price scenario ($33,700) are not that much different from the low price scenario ($24,100). This occurs because crop insurance payments are offsetting crop revenue declines resulting from lower prices. Net farm income without insurance is -$168,300. Significant erosion in financial position would occur in under this price scenario.
Summary
For the farm shown in this paper, current projected prices for 2012 result in above average incomes for 2012. Lower prices result in significantly less income, but crop insurance likely would keep income positive.
The without insurance scenarios represents cases in which projected prices have adjusted downwards, thereby providing farmers with no price protection from crop insurance. The low price scenario is likely to happen in the future, showing that grain farmers are at risk from low prices. These incomes also illustrate that crop insurance is good at protecting against within year events, but does not provide protection against adverse events that occur across years, suggesting a need for a Federal commodity program to protect against across year price declines.
These projected incomes are based on a particular tenures relationship: 10 percent owned, 30 percent share-rented, and 60 cash rented. Different tenure relationships result in different net incomes. In particular higher levels of cash rent cause incomes to change more with price changes. Hence, farms with a higher percentage of cash rent acres will face price larger incomes declines with lower prices.
Disclaimer: We request all readers, electronic media and others follow our citation guidelines when re-posting articles from farmdoc daily. Guidelines are available here. The farmdoc daily website falls under University of Illinois copyright and intellectual property rights. For a detailed statement, please see the University of Illinois Copyright Information and Policies here.