


Understanding Current Prices: Lack of a U.S. Corn Yield Trend Since 2003
Introduction
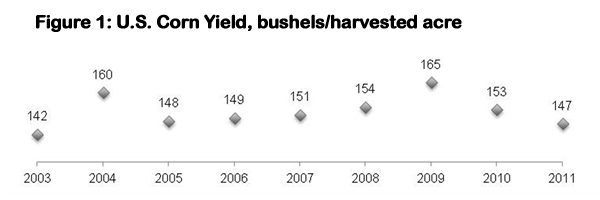
Growth in demand tops most lists of causes of the post-2005 run-up in the price of farm commodities. The growth in demand has two primary sources: (1) world-wide growth in income and the associated demand for food and (2) increased use of farm commodities for biofuels. However, supply factors also have a role in explaining current prices. This article highlights a seldom-discussed explanatory factor: lack of a trend in average U.S. corn yields over the last 9 years (see the Figure 1 below, constructed using data obtained from the USDA, National Agricultural Statistics Service, accessed October 17, 2011 at http://www.nass.usda.gov/Data_and_Statistics/).
Discussion
Statistical analysis finds no statistically significant time trend in average U.S. corn yields since 2003. Thus, the increase in consumption of U.S. corn from 10.2 billion bushels to 12.6 billion bushels between the 2003/04 and 2011/12 crop years, has largely been met through an increase in planted acres of 13.3 million (from 78.6 million acres to 91.9 million acres).
It is important to note that it is not uncommon to find no statistically significant trend in U.S. average yield over a 9 year period. Of all 64 9-year periods starting with the 9 years that begin in 1940, less than half had a statistically significant upward trend in corn yields. This may seem surprising since the average annual increase in U.S. average corn yields since 1940 is 2.2% per year.
The lack of a yield trend since 2003 underscores that other factors, such as weather and changes in acres both within and among states, may offset the importance of genetics over not just one or two years but also over intermediate lengths of time. While the identification and role of these other factors for 2003-2011 requires additional analysis, this recent history contains useful implications.
Implications
Assumptions about yield trends need to be made with caution, especially in regards to whether long-term trends will exist over short and intermediate lengths of time. This need for caution applies to strategic planning and management of risk by farms and agribusinesses, as well as the design of public policy, such as the farm safety net.
While demand has been at the center of discussions over current high prices, supply factors should not be overlooked.
Resumption of the long-term upward trend in average U.S. corn yields would temper and might end the crop boom even if demand remains strong. For example, a U.S. 2012 yield of 165 bushels/acre and 85 million harvested acres (both plausible) equal U.S. corn production of 14 billion bushels, over 1 billion bushels more than projected 2011/12 consumption. Lower prices will be needed to absorb this large of an increase, especially if yields for other U.S. crops and crops in the rest of the world are normal to above average.
Disclaimer: We request all readers, electronic media and others follow our citation guidelines when re-posting articles from farmdoc daily. Guidelines are available here. The farmdoc daily website falls under University of Illinois copyright and intellectual property rights. For a detailed statement, please see the University of Illinois Copyright Information and Policies here.