


Crop Insurance Decisions in 2012 – Some Final Thoughts
The Risk Management Agency (RMA) has now concluded its price discovery period used to determined final prices and volatility factors for federally sponsored corn and soybean crop insurance products for 2012. For the majority of the midwest, the Projected Price for corn is $5.68 and the volatility factor relating to the price risk is anticipated to be .22. For soybeans, the Projected Price is $12.55 and the volatility factor is likely to be .18. For comparison, the 2011 prices (volatility factors) were $6.01 (.29) and $13.49 (.23) for corn and soybeans respectively. The Projected Prices are used to determine the guarantee revenue indexes based on futures prices and do not reflect local basis. The Projected Price for corn is determined by averaging the closing December futures price during the trading days of February, and for soybeans by averaging the November Futures closing prices. The volatility factors are determined by an average of the most recent five trading days’ implied volatility estimates, scaled for the interval of time from now until the middle of October — the month during which average prices are used to determine Harvest Prices. For both corn and soybeans, the volatility factors are considerably lower than in 2011 which has important implications for premiums and for the value of the Harvest Price options.
Adding to the complexity this year, the enterprise discount was modified, and several other specific ratings changes were implemented with differential cost impacts by location and across products (especially divergent in some cases between group and farm products). Additionally, the Trend Adjusted APH Endorsement has the potential to significantly increase the guarantee coverage available to many famers. The result is a dizzying array of choices across products and election levels using newly established rates, and in many cases expanded effective coverage options for crop insurance in 2012.
So how can one sensibly evaluate their 2012 crop insurance options for their own case? The following materials provide one approach for evaluating the most important crop insurance product and election choices facing corn and soybean producers using the University of Illinois iFARM crop insurance evaluator.
The case presented is for McLean Co., Illinois for corn (this case, and similar analyses for approximately 600 other counties throughout the midwest for both corn and soybeans under both basic and enterprise elections are available at the farmdoc website at: http://www.farmdoc.illinois.edu/cropins/toolbox/Common_Files/cropinstoolsmain_2012.asp?num=3 ).
The case farm information and starting price conditions are shown in the table below. It is assumed that the farm qualifies for the Trend Adjusted APH endorsement which takes its average APH from 174 to 183. The county standard deviation of yields is estimated to be about 22 bu./acre and the farm yield risk is about 5 bu./acre higher. Some basic risk information is given related to yield risk (e.g., 1 in 10 years the farm yield will be below 147), and the average gross revenue with no insurance is calculated at $960/acre. The gross revenue calculation reflects the negative correlation between the yield and prices, as well as simulated local basis conditions. The average futures price is a result of the process used to model the price distribution implied by the options markets for the settlement period and can differ from current futures prices at any point in time. Consistent with RMA rules, the APH and Trend APH are rounded to nearest whole bushels, and other features of the indemnity calculations are maintained to comply within RMA rules and procedures.

The next table shows approximate premiums and guarantee values for the available products, unit decisions, and coverage levels in this county for the case farm shown. The group products are calculated assuming 100% liability price elections. Importantly, the revenue guarantee levels are calculated with reference to the underlying Projected Price which does not account for local basis.
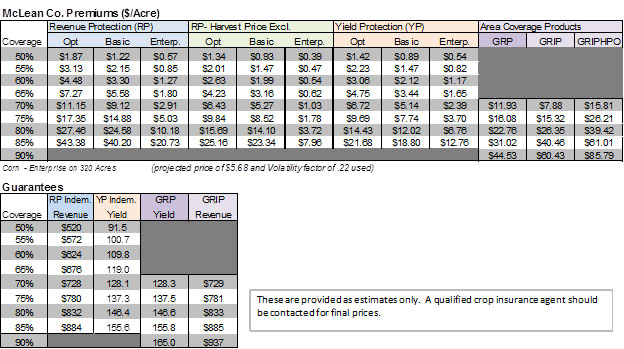
As is the case across the majority of the corn production region, the Enterprise policy is much less expensive than Basic or Optional coverage, both because of the lower risk represented, and the higher subsidy rates associated with Enterprise coverage. Moreover, the policies with the Harvest Price Exclusion are also considerably less expensive. Under RP-HPE, the guarantee level is dependent on current projected prices and does not increase if harvest prices are higher. Under RP, if the Harvest price is higher than the projected price, the guarantee increases to reflect the higher price. Currently, December corn futures prices and the projected price are nearly identical. In soybeans, however, the current November futures price is above the Projected Price thereby increasing the relative attractiveness of RP compared to RP-HPE. More detailed price quoting information is also available at the farmdoc website at: http://www.farmdoc.illinois.edu/cropins/index.asp.
The remainder of the presentation focuses on Enterprise units as many farmers will find Enterprise policies to be a better choice because the policy will be less expensive and more related to overall revenue from the crop insured. Comparable analyses considering Basic units are available at the farmdoc website for those interested.
The following table provides the average payments per acre expected if this year’s conditions were repeated over and over, a large number of times, and the average across all iterations calculated. As shown in the table, the payments increase as election levels increase reflecting the increased value of coverage for all insurance products. The Yield Protection policy would be expected to make average payments of $14.76 at the 85% election level over a large number of times. Of course, many years the payments will be zero, and some years the payments would be much higher. Notice that the RP policy always is expected to make larger payments than the RP-HPE policy, but not always by as much as the difference in premium costs. Under an 85% election, for example, RP would be expected to make indemnity payments of $32.29 per acre on average over a large number of years, while the RP-HPE policy would make average payments of $25.22. The highest coverage GRIP policies also have the highest average payments and the HPO policy has the highest average payments to accompany its higher premium cost (note: unlike RP-HPE, the Group policy option requires an election into the harvest price option GRIP-HPO, rather than opting out or excluding the option as in RP-HPE).

Next, a table is provided with the frequency of payment, or the fraction of years that at least some payment would occur. As can be seen in the table, the YP policy makes payments in about 15% of years at an 85% election and virtually never gets triggered at lower coverage levels. The revenue policies increase in frequency faster as coverage levels are increased due to the possibility of price movements also generating claims even under near typical yields. In the case of RP at 85%, a farm with these characteristics would expect to a claim in about 28% of the years. YP by contrast will pay in only about 15% of the cases.

The following table combines information from the previous tables and presents the net cost of insurance expected over time given the starting conditions of the farm and the insurance provisions for this year. Net cost is defined as the farmer paid premium less the average payment received. A negative “cost” indicates that the product pays back more on average than it costs — as would often be expected given the overall target loss ratio of approximately 1.0, and the fact that the farmer paid portion of the premium is subsidized to encourage participation. As shown in the table, Revenue Protection pays back on average about $11.56 more than its premium cost while under RP-HPE a producer would expect to gain $17.26 over the long run by purchasing this insurance. Although sometimes counterintuitive, numbers in parentheses that are larger are more negative and are thus more preferred. Higher positive numbers are associated with larger net costs through time. A zero would be a breakeven policy that paid back just what it cost over time. Recall that the RP policy pays more on average and in more years, but the lower premium cost of the HPE policy more than offsets the payment differences in this case. GRP has a net cost that is positive indicating that even with subsidy considered, it is not expected to return even the producer paid portion of the premium, and the GRIP policies do generally return about the amount of subsidy through time as expected.

Net cost does not provide a complete picture of the impact of insurance usage however as it is also important to understand the impact of insurance on the likelihood of experiencing particularly low revenues. For example, one might be most interested in which insurance allows a farmer to bid most for cash rent, or insure that all variable costs can be covered, or do the best job of offsetting particularly low revenue outcomes under hedged production, and so on. One way to begin to understand this type of impact is to examine the VARs or “Values at Risk” under different insurance contracts. A 5% gross revenue VAR, for example, shows the value at which 5% of the possible outcomes fall below, and 95% of the outcomes exceed. The table below shows the 5% VARs for the various insurance products and elections to better help appreciate the relatedness of payments to revenue shortfall. Notice that with no insurance, the 5% VAR for revenue is $610. Using YP insurance at the higher coverage levels improves this situation slightly increasing the VAR to $622. RP and RP-HPE do a far better job of “cutting off the low tail” of the revenue distribution and provide substantially better downside risk protection. A producer considering covering $750 in total production costs would find higher elections of the revenue products most appealing. The GRP policy actually makes the risk position slightly worse in this case, and the GRIP policies, while paying slightly higher totals through time, do not do as well at limiting downside revenue risk. Payments from the GRIP policies are simply less correlated with farm-level revenues and thus can occur when not needed as much or occur when not as needed to cover crop revenue shortfalls.

The final information presented in the graph below helps summarize the impacts across the lower tail of the revenue distribution. The bottom axis gives levels of gross revenue with insurance payments, less premiums paid. The vertical axis shows the probability of occurrence. Because distributions with higher likelihood of higher revenue are preferred, lines to the bottom and right are preferred to those above and to the left in this graph. The dark blue line provides the possible revenue outcomes with no insurance. For example, there is a 5% chance of revenue with no insurance being below $610 and a 10% chance of revenue being below $672, a 25% chance of being below $790, and so on without insurance. Purchasing insurance has two types of consequences on the revenue distribution — first, it shifts the whole schedule left by the amount of the premium. Then, it adds back payments to outcomes covered by insurance, there by shifting specific portions of the revenue distribution back to the right. Ideally, insurance should make payments when revenue is lowest and not make payments when revenue is highest resulting in an overall shift in the revenue distribution to the right at lower revenue levels, and resulting in lower revenues when only premiums are paid and no indemnities are paid (top portion of the curves are not shown in the graph, but would be shifted to the left of the no-insurance case). As can be seen in the graph, GRP actually reduces the revenue distribution relative to no insurance over most of the lower half (probability less than 50%) of the revenue distribution. YP85 provides minimal, but positive protection over the bulk of the range of revenues presented. RP 85% and RP-HPE 85% do the best job of “cutting off the tail” of the revenue distribution with minimum revenues of roughly $750 guaranteed in most cases. The GRIP outcomes are interesting in that they pay back more than premiums over a large range of revenues, but do not protect against particular revenue shortfalls as well and in years with high crop revenue actually cost the most in terms of total revenue due to their higher initial premiums.

Similar patterns to these results occur with soybeans, although with more muted magnitudes, and in many locations with relatively less valuable group options. These cases and cases involving Basic units are also provided at the farmdoc website: http://www.farmdoc.illinois.edu/cropins/index.asp
Crop insurance is increasingly viewed as providing the cornerstone for active risk management programs, and its importance is elevated in environments with higher input costs and greater margin risk. The differences in underlying rates and starting price and volatility conditions can substantially impact the relative performance of the alternatives from year to year, and across different operations within a given year. Hopefully the iFARM Crop Insurance Tools will provided producers with insights needed to make informed crop insurance decisions.
Visit the crop insurance tools section of farmdoc on the web at: http://www.farmdoc.illinois.edu/cropins/index.asp
Disclaimer: We request all readers, electronic media and others follow our citation guidelines when re-posting articles from farmdoc daily. Guidelines are available here. The farmdoc daily website falls under University of Illinois copyright and intellectual property rights. For a detailed statement, please see the University of Illinois Copyright Information and Policies here.