


Payments from a 70% Yield Insurance
In an article entitled Giving it Away Free (see here), the Environmental Working Group proposes that Federal crop insurance programs be replaced with a yield insurance at a 70% coverage level. The 70% yield insurance would have no cost to farmers. In this blog post, size and timing of payments of 70% yield insurances are examined for corn and soybeans in select Illinois counties. Payments from a 70% yield policy would generally be low. As would be expected, areas with higher yield variability would receive higher payments. Payouts from the policy would occur primarily in drought years like 1988, not necessarily corresponding to low revenue years.
Size of 70% Yield Insurance Payments
The Risk Management Agency (RMA) has offered yield insurances with 70% coverage levels since 1996. Between 1996 through 2011, the average per acre payment on all acres insured in Illinois with 70% yield insurances is $.34 per acre for corn and $1.30 per acre for soybeans.
For a number of reasons, historical payouts may understate future payouts. An evaluation of likely payments from 70% yield insurances is given in the iFarm Crop Insurance Payment Evaluator available in the crop insurance section of farmdoc (see here). These payments represent expectations for 2012: if 2012 could be repeated a number of times the average of insurance payments would equal the expectations. Payments are given for enterprise units using 2012 projected prices of $5.68 per bushel for corn and $12.55 per bushel for soybeans.
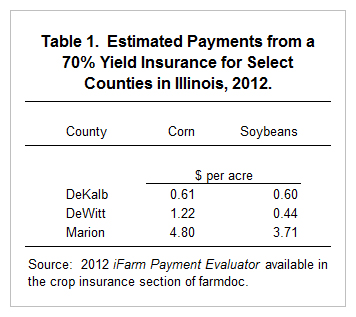
Table 1 shows yearly expected average payments for three counties in Illinois. DeKalb County is in northern Illinois, DeWitt County is in central Illinois, and Marion County is in southern Illinois. Marion County has significantly more yield variability than DeKalb or DeWitt Counties. For corn, per acre payments are $.61 per acre for DeKalb County, $1.22 per acre for DeWitt County, and $4.80 per acre for Marion County. For soybeans, per acre payments are $.60 per acre for DeKalb County, $.44 per acre for DeWitt County, and $3.71 per acre for Marion County.
For both corn and soybeans, Marion County has higher payments than either DeKalb or DeWitt Counties because Marion County has higher yield variability than DeKalb and DeWitt Counties. Note that differences would be more pronounced if a wider geographical area is considered. Even though Marion County has variable yields from an Illinois perspective, Marion County does not have as variable yields as many areas of the United States.
Providing the same coverage level for all regions may not be advisable for a number of reasons. First, there tends to be a correlation between yield variability and land productivity, with higher land productivity having lower variability. Providing 70% yield insurances would tend to provide fewer payments to higher productivity areas. Second, yield variability likely is not a good representation of risk. Areas with higher productivity and lower yield variability likely will have higher land costs, either in the form of land prices or rental rates, than areas with lower productivity and higher yield variability. Given higher land costs, having a constant coverage level across areas may result in less risk protection in more productive areas.
Timing of crop insurance payments
In Illinois, yield insurances tend to make larger payments in very few years, as illustrated in Figure 1. Figure 1 shows a 70% crop insurance program had it existed for all farms in DeWitt County Illinois. Bars give yearly payments averaged across all farms in DeWitt County, stated in terms of a $5.68 projected price. These measures were used to state historical payments in terms of today?s values. Average crop insurance payments only exceed $10 per acre in three years: 1980, 1983, and 1988.

The 70% yield insurance does not necessarily make payments in years in which crop revenue is low. Figure 1 also shows a read line that gives a ratio of the current year?s crop revenue (yield x price) relative to the average of the previous five-year average. A value of 1.0 means that the current year revenue equals the average revenue of the five previous years. Ratios below 1.0 indicate financial stress within agriculture. The ratio was below 1.0 for an extended period during the mid-1980s and late 1990s (see Figure 1), both periods of financial stress within agriculture. Payments from 70% yield insurance do not match well periods of financial stress. This explains why farmer prefer revenue insurances, which tend to better match periods of revenue shortfalls. It also explains why so called shallow loss programs like ARRM have farmer support, as they tend to make payments in years when revenue is low (see here).
Summary
Yield insurances with 70% coverage level would make very small payments on most Illinois farms. Payments from this yield insurance would not necessarily match years of low income.
Disclaimer: We request all readers, electronic media and others follow our citation guidelines when re-posting articles from farmdoc daily. Guidelines are available here. The farmdoc daily website falls under University of Illinois copyright and intellectual property rights. For a detailed statement, please see the University of Illinois Copyright Information and Policies here.