


Comparing Revenue Protection Offered by ARC and SCO
Previous posts (here and here) have discussed some of the details for the Ag Risk Coverage (ARC) and Supplemental Coverage Option (SCO) programs as they are outlined in the Senate Ag Committee’s 2012 Farm Bill. While both programs are designed as risk management tools to provide revenue or yield protection to producers, the programs differ in their proposed design. This post discusses some of those differences, focusing on the prices and yields each program uses in determining payments.
Table 1 provides a comparison of some of the important differences between the two revenue programs. ARC provides revenue protection only, but can be elected at the farm or county level of aggregation. The band of coverage is between 79% and 89% of the revenue guarantee, which is based on 5-year Olympic averages of national cash prices and county or farm yields. SCO can be used as a revenue or yield protection program, and uses insurance futures prices and county trend yields. The band of coverage ranges from the farmer’s insurance coverage level to either 79% or 90% depending on their ARC enrollment decision. ARC payments are made on either 65% or 80% of planted acres (up to the farm operation’s total base acres), while SCO payments are received on all planted acres. ARC also has a $50,000 payment limitation whereas SCO does not. There is no direct enrollment cost associated with the ARC program, while SCO will have a subsidized premium. All of these will be factors to consider if these programs are included in the final Farm Bill as producer’s make their enrollment decisions.

Price Protection
Figure 1 reports the ratio of actual price to the guarantee for corn from 1977 to 2011 for both the ARC and SCO programs. Note that the prices used for both ARC and SCO are common to all regions, differing only by crop, so this historical comparison applies to all corn-producing regions of the U.S. For ARC, actual price is the national season average price and the guarantee is the Olympic average of the season average prices for the previous 5 years. For SCO, actual price is assumed to be the harvest price used for crop insurance and the guarantee is the base price used for crop insurance. Values for either series which fall below 0.90 (for revenue SCO) or 0.89 (for ARC) indicate periods when payments could potentially be triggered due to price declines from the programs.

While the series are positively correlated, there are differences between the two which would impact the timing of payments from each program. For example, there were fairly significant futures price declines from planting to harvest during the 1981, 1982, and 2008 crop years while the season average price in those years was above the Olympic average of the previous 5 years. This indicates that price-driven payments from a program like SCO could have been triggered while price-driven payments would not have been triggered from a program like ARC.
Since corn prices have been generally trending upward since 2005, the actual ARC program price has stayed above the historical based guarantee over that period while the SCO price did fall below its guarantee in 2008. If we were to experience a period of negatively trending prices in the future, price-driven payments from a program like ARC could potentially be triggered over a multi-year period (for example, see the low price scenarios examined in this post) while this might not be captured by the planting and harvest prices used for SCO.
Yield Protection
A comparison of the yield protection offered by either program will be specific to a county or farm for any given crop. As an example, figure 2 compares the ratio of actual corn yields to the guarantee yield for both the ARC and SCO programs from 1977 to 2011 for McLean County located in central IL. The yield guarantees used here for SCO are based on a simple linear trend fit to yields from 1972 to 2011. Changes in the time period and methods used to fit the trend could change the guarantees in any given year.

The two yield series are also positively correlated but, prior to 2006, the relative yield measure assumed for SCO tended to be lower than that used for ARC. Since 2006, the relative yield measure for SCO has been above that used for ARC. However, in years when yield-driven payments may have been triggered for either the ARC or SCO (observations below the dashed line), the relative yield measures tend to be similar for both programs. Again, the relative yield comparison is specific to the McLean County example for corn used here and does and will differ across other counties and crops.
Revenue Protection
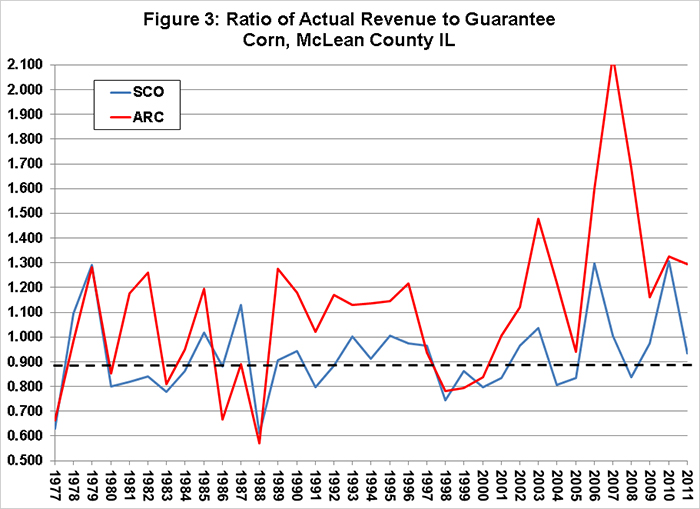
Figure 3 reports the ratio of actual revenue to the guarantee outlined under the ARC and SCO programs for corn, again using McLean County in IL from 1977 to 2011 as the example case. Either series falling below the dashed line indicates a period when payments would have been triggered from the ARC or revenue-based SCO programs. Both programs would have provided payments during periods in the late 1970s, the early and late 1980s, and the period of low prices in the late 1990s and early 2000s. Since 2005, the ARC program would not have triggered payments in McLean County while SCO would have provided support for corn acres in 2008. This is explained by the general increasing trend in the season average price for corn since 2005, and the relatively high intra-year price volatility over that time.
Summary
The proposed ARC and SCO programs in the Senate Ag Committee’s 2012 Farm Bill are both designed to provide yield or revenue protection for farmers. However, the prices and yields used for each program differ, impacting the type of risk protection offered by each program and conditions under which payments might be triggered. ARC’s revenue guarantee is based on recent historical averages of prices and yields implying that payments will not be likely to be triggered during extended periods of increasing prices similar to what has been experienced since 2005. In contrast, if the next Farm Bill period is characterized by a downward trend in commodity prices the ARC program could potentially provide large payments over multiple years. The SCO program, as proposed, uses futures prices in determining the guarantee and actual revenue similar to existing revenue insurance programs. Therefore, the price component of SCO protects intra-year price movements rather than price trends over time, supplementing the protection already offered by yield and revenue insurance products. Whether a producer feels their risk exposure is greater to a general decline in prices from recent levels or intra-year price volatility is one of many factors to consider in choosing among these new programs
Disclaimer: We request all readers, electronic media and others follow our citation guidelines when re-posting articles from farmdoc daily. Guidelines are available here. The farmdoc daily website falls under University of Illinois copyright and intellectual property rights. For a detailed statement, please see the University of Illinois Copyright Information and Policies here.