


Do Recent Prices Understate Downside Price Risk in Corn?
Yearly changes in Market Year Average (MYA) prices since 1973 have not included any years in which corn prices have decreased by more than 40%. In contrast, a price series beginning in 1886 — the first year in which the National Agricultural Statistical Service (NASS) reported prices — contains three percent of the years in which prices have declined by more than 40%. Using a longer-run price series suggests that corn prices have more downside risk.
Corn Prices and Price Changes
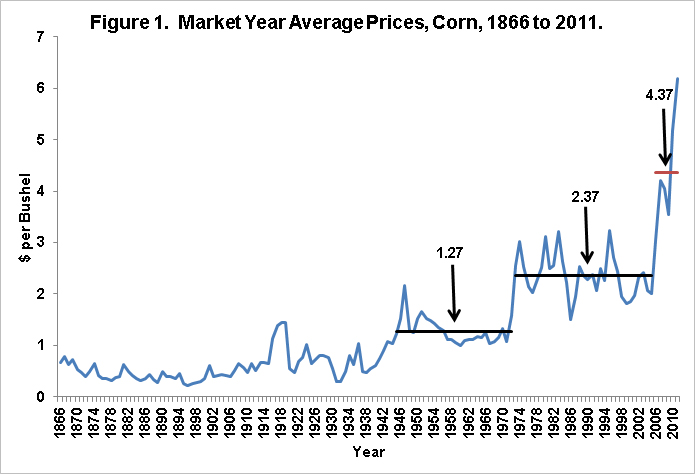
NASS reports MYA prices since 1866 (see Figure 1). MYA prices represent the average of cash prices received by farmers in the United States for corn sold during the marketing year. Since 1866, corn prices have generally risen, containing time periods in which corn price vary substantially around an average. Since World War II, there have been three of these periods. Between World War II up to the early-1970s, corn prices varied around an average price of $1.27 per bushel. Between the early-1970s to the mid-2000s, corn price varied around $2.37 per bushel. Since the mid-2000s, corn prices appear to have reached a new plateau and have averaged $4.37 per bushel. Generally, these periods are separated by structural changes in demand for corn. Predicting when these structural changes will occur is difficult.
Changes in corn prices from year-to-year can be large, as is illustrated in Figure 2. Visual inspection of price changes suggests that price variability is larger pre-World War II than post-World War II. This can be illustrated by the looking at the number of times prices have experienced a 40% decrease. There have been five years in which prices fell more than 40%: 1895, 1920, 1931, 1937, and 1948. Four of the five years occur prior to the beginning of World War II. None of these 40% decreases have occurred during recent times, which are defined here as the period since 1973 when corn prices rose to the $2.37 plateau.

Table 1 provides more quantification of less variability in recent times by showing frequencies of yearly price changes. For the entire time period, 3% of the time prices decrease by 40% or more. The frequency is 5% per-World War II and 2% post-WWII. In recent times, price decreases of 40% or more have not occurred.
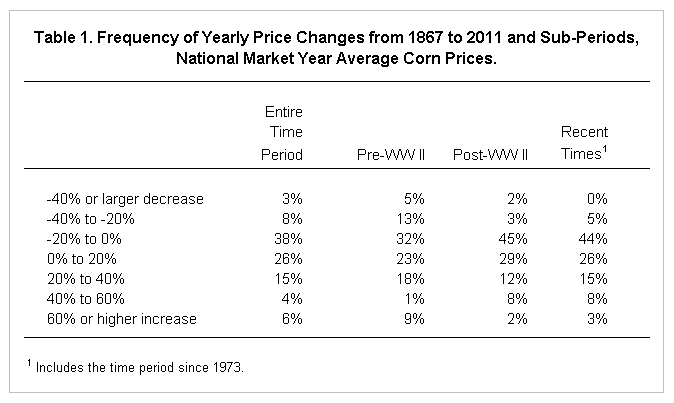
Overall, prices changes fall within a tighter range post-World War II. This is illustrated by the frequency of 40% or larger price decreases illustrated above. It is also illustrate by price increases of 60% or more. Over the entire time period, price increase of 60% or more occur 6% of the time (see Table 1). More of these large price increases occur pre-World War II: 9 percent pre-World War II compared to 2% post-World War II.
Summary and Commentary
Use of longer run price series when evaluating price variability suggests that corn prices are more variable than use of a shorter time period. While there are good reasons to believe that the economic structure has changed leading to less variable corn prices, considering a longer-run perspective is important for three reasons:
- Research suggests that most people place more weight on recent time periods, discounting too heavily experience from the more distant past. In this case, more weight may be being placed on the relatively less variable price experience.
- Models were used to predict defaults when making home mortgage loans prior to financial difficulties in home mortgage market. These models under-predicted the chance of default, thereby understating risk. One reason many of these models understated risk is that many of the models used only recent data in predictions, not including data from more distant periods in which defaults were more prevalent. Similarly, not considering the pre-World War II experience could be argued to understate variability.
- A 40% decrease in price is an extreme event that occurs rarely. Estimating these extreme events present difficulties and requires a long time-series. Not being in a recent time-series does not mean that there is no chance that the event will occur.
NASS currently is estimating the 2011 MYA corn price to be $6.20 per bushel. A 40% decrease in price would result in a 2012 MYA price of $3.72 per bushel. The chance of this occurring is greater than zero, the chance that would result by examining price changes since 1973. Its chance of occurring likely is less than the 3% frequency suggested examining prices since 1866. The chance likely is close to a 1 in a 100 year event.
Disclaimer: We request all readers, electronic media and others follow our citation guidelines when re-posting articles from farmdoc daily. Guidelines are available here. The farmdoc daily website falls under University of Illinois copyright and intellectual property rights. For a detailed statement, please see the University of Illinois Copyright Information and Policies here.