


2012 Drought, the Harvest Price Option, and Forward Contracting
Overview
Droughts always cause farm policy issues because of the stress they cause. A policy issue that has emerged during the 2012 drought concerns whether or not crop insurance should have a harvest price option (HPO). HPO permits the insurance guarantee to be calculated using the insurance price determined at harvest when it is higher than the insurance price determined prior to planting. This article examines the HPO policy issue. See the end of the post for a note on the use of the term, harvest price option.
Insurance and the Harvest Price Option (HPO)
For most corn and soybean acres, crop insurance uses the average December corn futures price and average November soybean futures price during the months of February and October. The October price will be referred to as the harvest price. For 2012, the February prices are $5.68 per bushel for corn and $12.55 per bushel for soybeans. The harvest prices are $7.50 for corn and $15.39 for soybeans. Thus, the HPO option increases per acre insurance payments for corn and soybeans by 32% and 23%, respectively
The impact of HPO upon insurance in 2012 is presented visually by comparing the revenue that insurance will guarantee when the harvest insurance price is used compared with the revenue that was expected in February. The revenue expected in February was calculated as the trend-adjusted yield times the February insurance price. The revenue guarantee was calculated as the trend-adjusted yield times harvest insurance price times the coverage level for individual farm crop insurance. Coverage levels vary from 50% to 85% in 5 percentage point increments. The data used in making these calculations were for Champaign County, Illinois; but, because the presentation is in terms of ratios or relative values, it applies to all situations.
Because of HPO and the increase in price between February and harvest, the farm’s guaranteed revenue equaled or exceeded the revenue expected in February as long as the farm’s insurance coverage was approximately at the 75% level for corn and at the 80% coverage level for soybeans (see Figures 1 and 2). To put this finding in perspective, current data from the Risk Management Agency reveals that 48% of the acres planted to corn in 2012 were insured at coverage levels of 75% or higher with HPO. For soybeans, 22% of planted acres were insured at coverage levels of 80% or higher. Thus a large number of acres fall into the situation in which the guaranteed revenue with HPO exceeded the revenue expected in February.
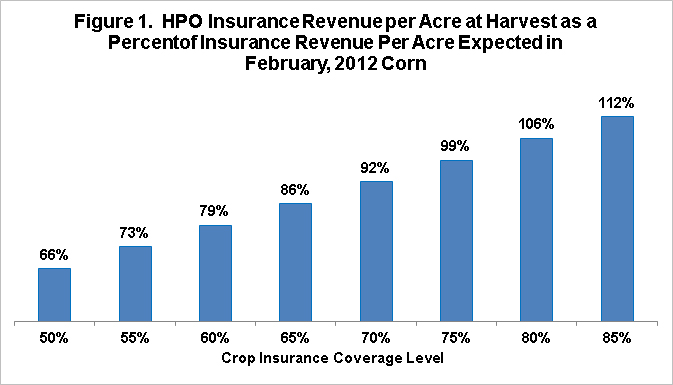
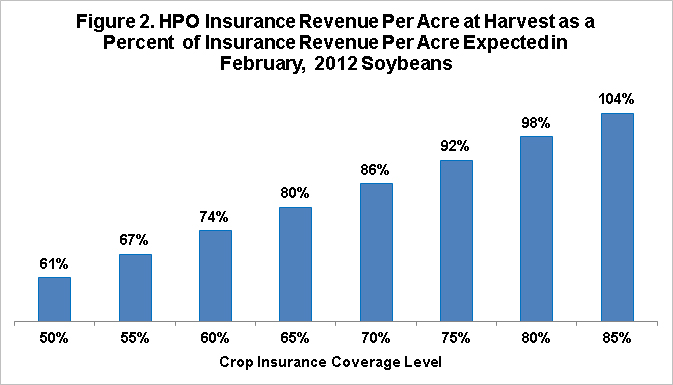
Critics complain about the increased cost resulting from HPO in 2012. However, they are also concerned that, as Figures 1 and 2 illustrate, at coverage levels that were commonly purchased for corn and soybeans in 2012, the insurance payment could result in a farm having more revenue than was expected in February. They wonder whether a foundation idea behind the farm safety net is being violated: that a loss is shared between the farm and public. It is important to note that the HPO debate is not over whether the cost of HPO in crop insurance is priced appropriately or whether HPO should be an option in crop insurance. The debate is over whether or not the public should subsidize HPO.
HPO and Forward Selling
Supporters of HPO argue that it allows farms to have more confidence in forward selling their production. Forward selling creates a risk: that harvested production may turn out to be less than the amount forward sold. Any amount forward sold in excess of production may have to be bought back at a higher price. This risk may cause farms to reduce the share of production that they forward sell. Imbedded in this argument is the notion that forward contracting improves marketing performance. This post now examines this notion.
Forward selling can improve pricing performance in two ways: (1) increase average revenue and (2) reduce the variation in revenue across years. To simply the discussion, this analysis calculates a combined measure by dividing average revenue by the standard deviation of revenue. A higher ratio means that either average revenue has increased or the standard deviation of revenue has decreased or both of these changes have occurred.
A simple analysis is conducted using the pre-planting and harvest insurance prices for corn, upland cotton, grain sorghum, soybeans and wheat. These prices are obtained from data sets compiled by Dr. Art Barnaby at Kansas State University and the Risk Management Agency. The wheat price series are based on the Chicago wheat contract. The price data begin with 1974. The analysis stops with 2006. The reason for selecting this period is that prices had no trend over this period ((see the farmdoc daily post by Scott Irwin and Darrel Good, “A New Era in Crop Prices,” available here). Trends can substantially affect the validity of statistics, including measures of risk. The reason for using this set of commodities is to see if regularities emerge since HPO applies to most insurance contracts. Yield is calculated for the U.S. and is on a planted acre basis, including adjustments for corn and sorghum silage acres. A trend yield is calculated for each year based on the 1974-2006 yield trend. A share of production is sold at the pre-plant price, with the remaining production sold at the harvest price. Any forward selling in excess of the harvested production is bought back at the harvest price.
A common pattern exists. Some forward selling causes the ratio of average revenue to the standard deviation of revenue to increase, but after attaining a maximum the ratio begins to fall as additional forward selling occurs (see Figure 3). The rate of decline usually becomes more pronounced as forward selling approaches 100% of expected production.

Unsurprisingly, the share of production at which the pricing performance ratio is at its highest varies by crop. However, with the exception of upland cotton, the maximum ratio falls between 20% and 31% of expected production. The average ratio across all 5 crops is 30%. Moreover, 78% of the increase in the cotton ratio is achieved at a 30% forward selling ratio. As an aside, I have asked probably over 100 farmers over the last 30 years what their experiences have taught them about the amount to forward contract? By far, the most common answer is between 1/4 and 1/3 of expected production before planting. This unscientific evidence is not inconsistent with the simple analysis conducted here.

Summary Observations
- The harvest price option can result in a situation where a farm has more revenue at harvest than the revenue that was expected prior to planting, even after experiencing a decline in yield. This situation has occurred in 2012. Critics are asking whether this situation is fair and whether the definition of loss is appropriate.
- Supporters of the harvest price option contend that it provides protection against a risk of forward selling. Specifically, a farm may over sell, thus having to buy back the excess amount. Imbedded in this argument is that forward selling improves pricing performance.
- A simple analysis finds support that forward selling at the time that the insurance price prior to planting is determined improves pricing performance. However, the improved pricing performance is achieved at forward selling around 30% of production when averaged across the analysis for corn, upland cotton, grain sorghum, soybeans, and wheat, using U.S. yield data and crop insurance price data.
- While underscoring the simplicity of this analysis, it suggests that offering the harvest price option on all insured production may lead farmers to sell more than is consistent with appropriate risk management.
- The author suggests that a reasonable policy criteria for crop insurance is that it should not encourage farms to engage in activities inconsistent with prudent farm management. Given this criteria, this analysis suggests that an argument can be made for including the harvest price option in insurance contracts but only for an amount equal to somewhere around 1/4 to 1/3 of expected production. This specific amount is subject to confirmation by additional analyses.
- Debate should occur over the term, prudent management, and the measurements used in this paper. Nevertheless, the basic idea proposed by this article is that the design of crop insurance contracts should not encourage farms to increase risk or to engage in other activities that are not consistent with prudent management.
Note on the term, Harvest Price Option:
Prior to the 2011 crops, farms elected HPO as an insurance feature when making insurance decisions. With the launch of the so-called COMBO policy, HPO is the default and farms elect out of HPO. Thus, it is more appropriate to call it the harvest price exclusion (HPE). Nevertheless, harvest price option remains commonly used.
This publication is also available at http://aede.osu.edu/publications.
Disclaimer: We request all readers, electronic media and others follow our citation guidelines when re-posting articles from farmdoc daily. Guidelines are available here. The farmdoc daily website falls under University of Illinois copyright and intellectual property rights. For a detailed statement, please see the University of Illinois Copyright Information and Policies here.