


What’s Driving the Surge in Ethanol Imports?
With ethanol production margins under pressure in recent months there has been an understandable search for explanations. One widely-discussed factor is the recent surge in “cheap” imports of ethanol to the U.S. from Brazil. As Figure 1 documents, the volume of ethanol imports to the U.S. definitely has risen notably in the in the last few months. Total imports during January-May 2012 totaled only 43 million gallons, but increased over five-fold to 235 million gallons over June-September. It is important to keep in mind that ethanol imports have actually been much larger in the past. The U.S. imported a total of 1.7 billion gallons of ethanol in 2006-2008, mainly due to an immediate need to replace MTBE as an oxygenate in our motor fuel gasoline supply.
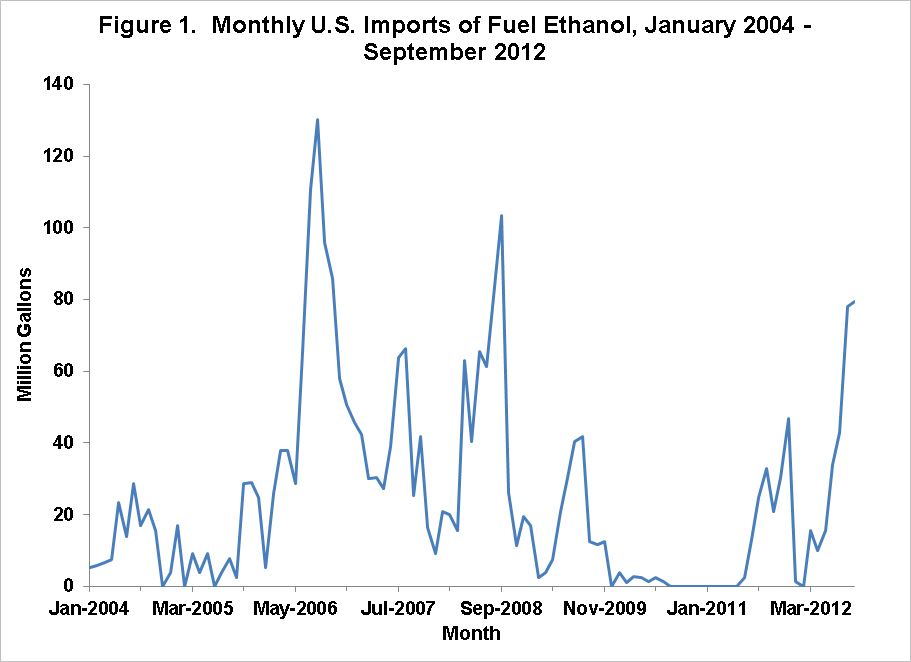
It is easy to answer the question of where all the ethanol imports come from. The U.S. and Brazil produce about 90 percent of the ethanol in the world, so Brazil has been the source of virtually all ethanol imports to the U.S. (Official statistics show some imports coming from Caribbean countries but this is just the re-export of Brazilian ethanol through these countries for tariff and logistical reasons.) It is also easy to answer the question of when the ethanol imports occur. Brazilian ethanol is made from sugarcane and the cane harvest season is roughly from mid-June to mid-December, so the bulk of ethanol supplies for export to the U.S. are available in the second half of the calendar year.
The question of why such large quantities of ethanol imports have been coming to the U.S. from Brazil in recent months is not as simple, but there is an answer. First of all, the answer is NOT that Brazilian ethanol is cheap relative to U.S. produced ethanol, as many apparently believe. This can be disproved rather straightforwardly. The price of U.S. produced ethanol at Gulf terminals on Thursday November 29, 2012 was $2.60 per gallon. On the same day, the price of (anhydrous) ethanol F.O.B. at the Brazilian port of Santos was $2.65 per gallon. Assuming freight costs are 20 cents per gallon, the landed cost of Brazilian ethanol to the U.S. Gulf was $2.85. No U.S. gasoline blender would have purchased Brazilian ethanol based on market economics because it would have resulted in a net loss of 25 cents per gallon compared to purchasing U.S. produced ethanol at the same location.
So what is driving the large ethanol imports from Brazil? The answer is found in the details of the U.S. Renewable Fuels Standards (RFS). Brazilian sugarcane ethanol production qualifies as an “advanced” biofuel under the RFS greenhouse gas (GHG) calculations. (See our earlier post for further details.) This means that the relevant economic comparison is between Brazilian ethanol and other biofuels that qualify for the advanced component of the RFS. Since the corn-based ethanol has a less favorable GHG reduction rating, it only qualifies as a “renewable” biofuel, and therefore, cannot compete with Brazilian ethanol or other advanced biofuels to fulfill the advanced mandate. To date, the only other biofuel that has been produced in quantity and qualifies to meet the advanced component of the RFS is biomass-based biodiesel. This means the relevant economic comparison is whether U.S. produced biodiesel or Brazilian produced sugarcane ethanol is the cheapest source for fulfilling obligations under the advanced RFS.
Recent price data reveals that Brazilian ethanol is by a wide margin the cheaper of the two alternatives. For example, consider a U.S. energy producer that is faced with this data on gasoline and diesel blending economics on November 29, 2012:
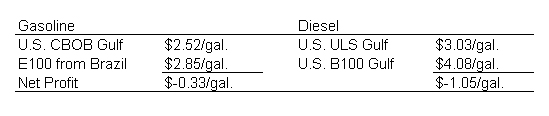
where CBOB is conventional gasoline blendstock, E100 is 100 percent anhydrous ethanol shipped to a Gulf terminal from Brazil (same as before), ULS is ultra low sulfur diesel, and B100 is 100 percent biodiesel. One final conversion must be done to make a fair comparison. Since biodiesel is worth 1.5 gallons of ethanol in the RFS math, we need to divide the net profit for diesel blending by 1.5 to arrive at a net profit of -1.05/1.5 = $-0.70 per gallon. This makes biodiesel almost twice as expensive as imported Brazilian ethanol when it comes to meeting the advanced RFS mandate. And that is the reason why Brazilian ethanol imports are surging into the U.S. during recent months. They will continue to do so until the non-biodiesel part of the 2012 advanced mandate is met (about 500 million gallons total) but will not be higher since blenders are still taking a loss on each gallon of Brazilian ethanol imported.
Implications
Ethanol imports from Brazil have surged into the U.S. in recent months. This is not because Brazilian ethanol is cheap relative to U.S. produced ethanol; instead Brazilian ethanol is the least cost blending alternative in terms of meeting the advanced RFS biofuel mandate. This can obviously change and is something to monitor. In particular, the reinstatement of the $1 per gallon tax credit for biodiesel blending, which is being tossed around the halls of the U.S. Congress, could flip the blending economics in favor of biodiesel in 2013. This could further increase the demand pressure on vegetable oil supplies and prices while at the same time providing more room for U.S. produced ethanol under the constraint of the E10 “blend wall.”
Disclaimer: We request all readers, electronic media and others follow our citation guidelines when re-posting articles from farmdoc daily. Guidelines are available here. The farmdoc daily website falls under University of Illinois copyright and intellectual property rights. For a detailed statement, please see the University of Illinois Copyright Information and Policies here.