


Distribution of Crop Insurance Net Farm Payments by Crop and State
Introduction
This post examines the distribution of net insurance payments by crop and by state. It briefly discusses two factors that help determine the distribution and ends with a discussion of policy issues, notably a potential alternative subsidy method that would change the distribution of payments.
Calculation of Net Farm Payments by Crop Insurance
Net insurance payments equal indemnity payments received by farms from crop insurance minus the insurance premiums paid by farms. Positive numbers indicate that farms have received more than they paid in. Negative numbers indicates that farm-paid premiums exceed payments.
Net insurance payments are calculated for crop years 2001-2012. The data for 2012 is not complete but a large share of payments likely has been made by this date. The calculation begins with 2001 because the Agricultural Risk Protection Act of 2000 made substantive changes to crop insurance, including changes to the premium subsidy. Payments are expressed as a share of the value of production.
The data presented in this article are averages. Because of the public subsidies for farms to purchase insurance and target loss ratios, average net farm insurance payments usually are positive. However, net insurance payments may not exceed zero for individual farms. An individual farm only receives a payment if it experiences a loss that exceeds its deductible in a given year. The net insurance payment calculation does not include the administrative fee paid by farms. This fee, which is currently $30 per insured crop per county, will somewhat reduce net payments.
Net crop insurance payments by crop
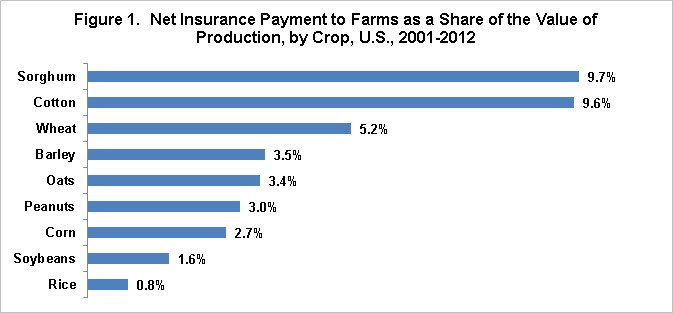
Over the 2001-2012 crops, net insurance payment as a share of insured liability ranged from 0.8% for rice to 9.7% for sorghum (see Figure 1). Stated somewhat differently, net insurance payment as a share of the value of production was 12.1 times greater for sorghum than for rice. Soybeans and corn had the next lowest payment ratios to rice. On the other hand, cotton has almost the same payment ratio as sorghum. To illustrate the interpretation of these numbers, rice producers received net payments from crop insurance that equaled to 0.8% of the value of rice production sorghum producers received net payments from crop insurance that equaled 9.7% of the value of sorghum production.
Net crop insurance payments by state
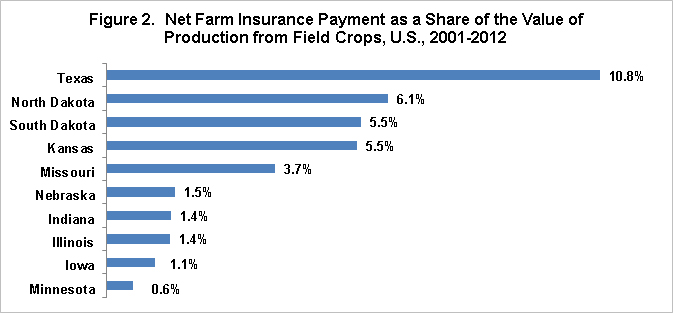
To simplify the presentation and discussion of the distribution of net insurance payments by state, Figure 2 contains net insurance payments as a share of the value of production only for the 10 largest states in terms of the value of production of all field crops between 2001 and 2011. The lowest share was 0.6% for Minnesota while the highest share was 10.8% for Texas. Among all states for which information on field crop production value was reported by the U.S. Department of Agriculture, Arizona was the lowest at 0.2% while Texas was the highest.
- Source: U.S. Department of Agriculture, Risk Management Agency. Data accessed in February 2013 at http://www.rma.usda.gov/.
- U.S. Department of Agriculture, National Agricultural Statistics Service. Data accessed in February 2013 at http://www.nass.usda.gov/Quick_Stats/
- Source: U.S. Department of Agriculture, Risk Management Agency. Data accessed in February 2013 at http://www.rma.usda.gov/.
- U.S. Department of Agriculture, National Agricultural Statistics Service. Data accessed in February 2013 at http://www.nass.usda.gov/Quick_Stats/
Distribution of net farm insurance payments and yield variability
Yield variability is clearly an important risk factor in agriculture and a key factor in determining payments made by crop insurance. Yield variability in turn is related to the variability of the agro-climate in which the crop is grown. Almost all rice is irrigated, reducing yield variability. Corn and soybeans are largely grown in the Midwest. The Midwest is less subject to drought and other growing season stress factors than the Plains and South. The latter are the principal growing areas for cotton, sorghum, and wheat.
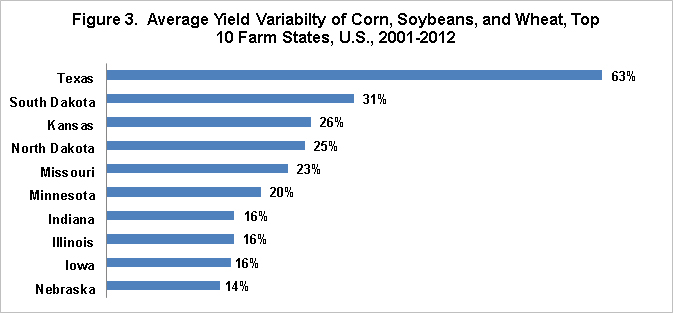
To examine yield variability by state, Figure 3 presents a measure of the variability of yield in the 10 states over the 2001-2012 crop years. Yield variability is measured as the standard deviation of the percent change in yield per planted acre from the previous year. This measure of yield variability is calculated for corn, soybeans, and wheat. Each of these three crops was grown in each of the 10 states in each of the 12 years in this period. Yield variability is averaged across the three crops.
- Source: U.S. Department of Agriculture, National Agricultural Statistics Service. Data accessed in February 2013 at http://www.nass.usda.gov/Quick_Stats/
This measure of yield variability ranged from 14% for Nebraska to 63% for Texas. Nebraska’s yield variability is lowest probably because of the widespread use of irrigation, particularly of corn. Iowa and Illinois, which are both corn belt states, had the second and third lowest yield variability. The three states next highest to Texas in yield variability were South Dakota, Kansas, and North Dakota. All four of these states are generally not considered to be corn belt states. The correlation between the ratio of net insurance payments to insured liability and the measure of yield variability is +0.92. A perfect correlation would be +1, implying that, as expected, yield variability is likely the major factor determining net payments to farms by crop insurance.
Policy Issues
The above discussion frames a policy issue that has taken on more interest as the amount of money spent on the crop insurance program has increased. As the above discussion has illustrated, crop insurance makes its largest payments to areas of the county which have the most risk, in particular yield risk. This understandable and expected outcome of the program has, however, raised the policy question of whether crop insurance is disproportionately benefiting more risky areas of production, which could then lead to increased production in more risky areas.
In addition, risky production areas may also be associated with increased levels of environmental sensitivity. There is evidence from academic studies to support this concern, but, in the authors’ view, the evidence at this time does not suggest that the impact is substantial. However, most of the studies predate the large increase in crop insurance cost that started after the 2000 crop insurance act. Thus, updated studies, using the current levels of subsidies and participation might find a larger impact. We think that such studies are important so that the discussion can proceed on a more contemporary factual basis. For a discussion of the existing studies, see Daniel A. Sumner and Carl Zulauf. Economic and Environmental Effects of Agricultural Insurance Programs. The Council on Food, Agriculture, Resource, and Environmental Economics. July 2012. Pages 8-12. Available here.
It is also important to raise for discussion potential solutions to the issue, so that their impacts can also be evaluated. It is not unknown that a perceived policy fix results in making a situation worse. We will discuss a significantly different approach to providing insurance premium subsidies that would also mitigate to a large extent the differential impact of insurance on production decisions.
At present, risk subsidies are based on a percent of total premiums. These subsidies vary by unit structure and coverage level, as can be seen in Figure 5. A straight percent of subsidy will subsidize more heavily those areas with higher risk, as total premiums will tend to be higher in risker areas.

- Source: U.S. Department of Agriculture, Risk Management Agency. Data accessed in February 2013 at http://www.rma.usda.gov/
An alternative policy is to establish a premium subsidy that is equal to a given percent of a crop’s gross revenue per acre. Starting from the perspective of no change in current spending on crop insurance, current spending levels on farm premium subsides suggest a subsidy per dollar of gross revenue of crops equal to 3% to 4% of the value of the production. Farmers would be free to choose whatever level and type of coverage they desire because the premium subsidy is not tied to a particular insurance product or particular coverage level. For example, a farmer could chose to “spend” his subsidy only for yield insurance, or only for the harvest price option, or only for prevented planting. The result would be that farms would be able to make decisions that are best for their farm situation, without evaluating the impact of the different subsidy levels on their decisions. You would of course change the distribution of net insurance payments from the distributions in Figures 1 and 2. These are important trade-offs that would have passionate supporters on all sides.
Summary Observation
What this post ultimately illustrates is that the general public is becoming more involved in the discussion over the operation and performance of crop insurance. This change is consistent with other policies that evolve from being a small spending program to a large spending program. The resulting increase in spending brings other actors to the discussion because the size of spending on the program is such that it now potentially impacts the amount of money available for other spending priorities. In addition, the higher is the spending on a program, the greater are the impacts of the program, both its positive and negative impacts. Supporters of crop insurance need to understand this shift in the political, social, cultural, and economic environment in which crop insurance is being discussed. Supporters of crop insurance need to adjust their arguments so that they speak not just to agents, farmers, and insurance companies; but also to the general public. Simply put, crop insurance supporters need to address the negative impacts that others see in crop insurance, either by supporting research that in an unbiased way refutes the criticism or by offering alternatives that mitigate the concern. Failure to do so is likely to lead to a smaller program and perhaps its disappearance. Ultimately, it was the inability or unwillingness of the farm community to address concerns with direct payments that has led to its questionable future. It will be interesting to see if the supporters of crop insurance can make this transformation.
Disclaimer: We request all readers, electronic media and others follow our citation guidelines when re-posting articles from farmdoc daily. Guidelines are available here. The farmdoc daily website falls under University of Illinois copyright and intellectual property rights. For a detailed statement, please see the University of Illinois Copyright Information and Policies here.