


Locating the 2012 Drought Using State Corn Yields
An examination of 2012 corn yields relative to trend yields provides evidence of where the drought had its worst impacts. For corn, the lowest state yields occurred in Kentucky, Missouri, Indiana, and Illinois. Most states in the southeast had above trend yields. Minnesota and North Dakota had yields close to trend.
2012 Yields Relative to Trend
Figure 1 gives a percent for each state that indicate a state’s yield relative to trend yield. For example, Illinois has a 62% yield relative to trend. This means that the 2012 yield of 105 bushels is 62% of the 169 bushel trend yield. The 169 trend yields results from statistically fitting a straight line through yield data from 1975 through 2011, and then extrapolating the yield to 2012. The 169 bushel yield represents an expected yield for 2012. If 2012 could be repeated 20 times, the average of the yields would be close to 169 bushels per acre. A value below 100% indicates that the state yield was below trend yield and a value above 100% indicates that the 2012 yield was above trend.
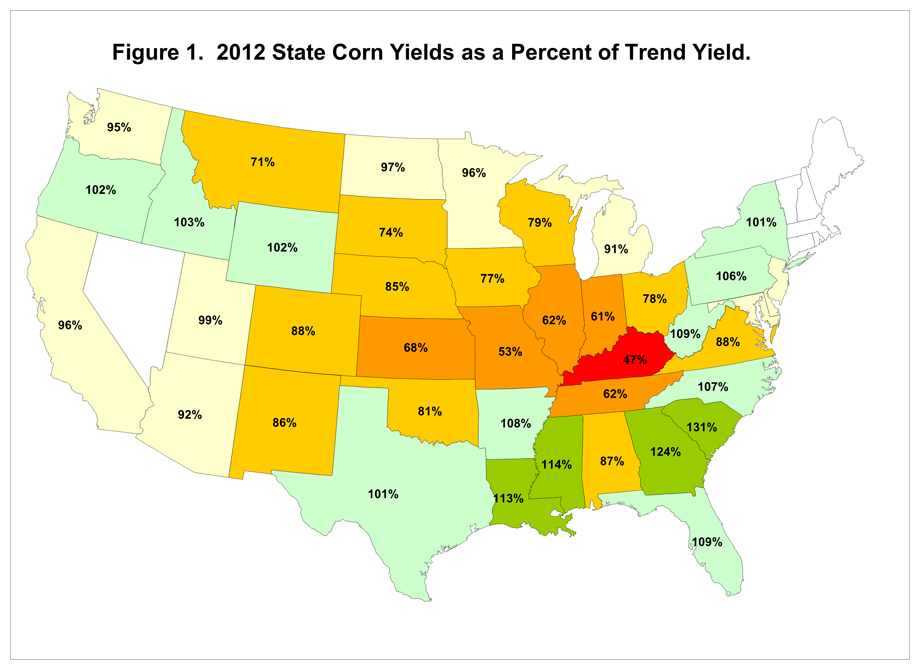
Relative to trend yields, the lowest yields were in Kentucky (47% of trend) and Missouri (53%). Most states adjacent to Kentucky and Missouri also had low yields. Indiana’s 2012 yield was 61% of trend, Illinois was 62% of trend, Tennessee was 62% of trend, and Kansas was 68% of trend. Overall the worst of the drought relative to corn yields was centered in an area running from Kansas through Missouri and Southern Illinois, into southern Indiana and Kentucky.
Most of the states in the western corn-belt had below average yields. Iowa’s 2012 yield was 77% of trend, South Dakota was 74% of trend, and Nebraska was 85% of trend. While below trend, yields in the western corn-belt were not as poor as in the eastern corn-belt. The drought had larger impacts on the eastern corn-belt than on the western corn-belt.
Other states had yields above trend. With the exception of Alabama, all states from Texas through North Carolina had above trend yields. States with exceptionally high yields include South Carolina (131% of trend), Georgia (124%), Mississippi (114%), and Louisiana (113%).
Another area that had near normal production was Minnesota (96% or trend) and North Dakota (96%).
Summary
The drought year resulted in its lowest yields from Kansas through Kentucky and impacted the eastern corn-belt worse than the western corn-belt. Because the corn-belt was impacted, lower total supplies of corn occurred as a result of this drought.
In some senses, though, the US dodged a bullet with the 2012 drought. Much lower total supplies would have resulted had the center of the drought occurred in eastern Iowa and northern Illinois. A center here would have impacted all of the corn-belt in a much worse way, potentially causing the western corn-belt to have as low of yields as the eastern corn-belt. As it actually occurred, Iowa and other western corn-belt state were not as badly hit as could have been the case.
Disclaimer: We request all readers, electronic media and others follow our citation guidelines when re-posting articles from farmdoc daily. Guidelines are available here. The farmdoc daily website falls under University of Illinois copyright and intellectual property rights. For a detailed statement, please see the University of Illinois Copyright Information and Policies here.