


Crop Insurance Program Losses in Perspective
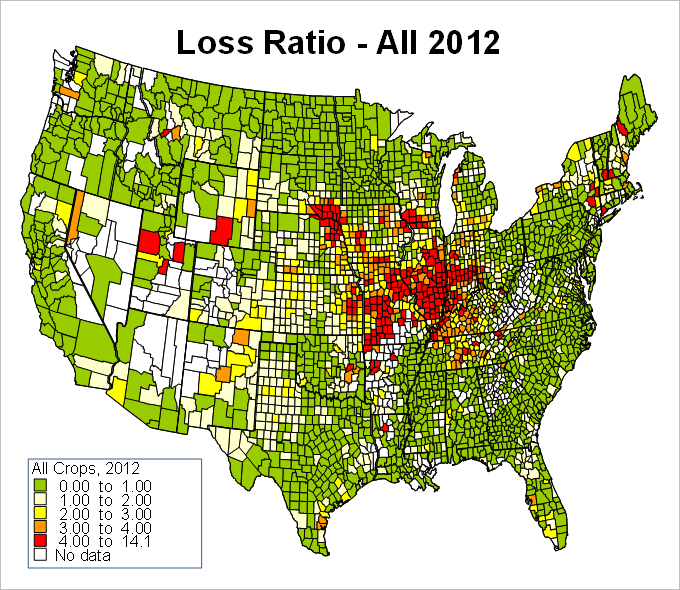
A recent post provided the magnitude of crop insurance losses related to the drought and other events of 2012 (available here), showing the concentrated losses in the heart of the corn belt, and corresponding closely to the areas experiencing the most severe drought conditions. The insert map shows results updated through present of the loss rates from 2012. Ensuing debates related to the Crop Insurance Title in the Farm Bill, and arguments by both supporters of crop insurance, and opponents alike have pointed to the experience and have used individual details to argue such things as: payments were too high to farmers; or, that more shallow loss coverage is needed; or, or that company losses were too great, or that rates are too high or too low; or, that subsidy was greater than needed to attract participation — the point is that a single year’s loss experience does not provide a very complete context to evaluate the performance of the program, and the extreme nature of the drought led to numerous extreme individual experiences. Furthermore, it is actually quite difficult to meaningfully aggregate across time due to the changing nature of coverage provided year to year, evolving product designs and customer shares, and the overall scale of the program that follows both price levels and participation rates through time.
This post provides one additional perspective on the performance of the program by controlling for the changing scale of the program through time, and by examining loss experience for both companies and farmers using a technique that is similar in spirit to the technique used to set insurance rates (and ultimately premiums and loss shares) in the first place. An important design feature of the federal crop insurance programs is that they target a long run average loss rate of 1.0 meaning that they are intended to run on a “break even” premium basis over the long run, and that actual loss experiences are used to control relative rates through time. Another important feature is that because RMA establishes controls on premiums, individual companies cannot individually compete on price, nor establish meaningful profit margins on products necessarily, and are subject to specific loss sharing arrangements established ahead of time through the SRA or “Standard Reinsurance Agreement” under which the government shares losses and takes a portion of gains as each accrue. Within the SRA, there is an important distinction based on the location of the state in which the policy is written such that historically lower risk states (IN, IL, IA, MN, NE) are deemed Group 1 states and others are deemed Group 2 states. The loss sharing arrangements differ by “group” designation. Finally, subsidy rates vary by both unit design and coverage level, and farmers systematically adjust their decisions based on annual price and volatility conditions in an effort to select the most valuable coverage available. An intent of the farmer subsidy is to encourage participation and to allow other marketing and pricing decisions to be made. Perhaps a larger intent is that if crop insurance programs work as intended, there is far less need for ad hoc disaster assistance programs which have difficulties in managing equity and in controlling expenses in many cases.
The system used by RMA to create insurance premium rates is a variant of a Loss Cost Ratio (LCR) approach. LCR approaches are commonly used in developing insurance rates when the historic experiences from which loss information can be gleaned differ in scale through time, or have other features that generally approximate conditions in crop insurance. In essence, an LCR calculates the loss experience rate at a point in time as (indemnity payments/liability) in individual pools of experience and then averages the loss experience rates over time to arrive at an insurance rate per unit of liability to be used to price future insurance. Adding in each year’s actual loss then should evolve toward an actuarially fair rate, even if the program size changes dramatically if certain other technical conditions are met. The idea might be explained with a stylized example in which a growing insurance pool had five years of liability and loss data which are to be used to establish insurance rates for the 6th year. Suppose the loss rates per dollar of exposure in the pool are independent in time – equivalent to being picked by rolling dice each year – and are drawn from the possible rates of 1% 3% 5% 7% and 9% with equal likelihood. One can reasonably argue that 5% is the average loss rate in this case and could be used as a premium setting starting point against liability. In this case, $100 of insured liability would carry an actuarially fair cost of $5 and $200 of liability would cost $10 and so forth. Losses and premiums would balance through time with variance of gains and losses determined by the spread in possible loss rates from 1% to 9% and by changing sizes of the insured pool. If the pool grew through time and the 9% rate happened by chance to occur in the time period with the most insurance in force, then the average loss through time would be greater than 5% and if the largest pool happened to occur when the loss rate was lowest, the average experience through time would result in lower than 5% average losses. This “sequencing” of random losses when program size changes illustrates one difficulty with assessing the loss performance in crop insurance as well as the program has grown dramatically over the past 20 or so years, and arguably the single largest drought experience happened (randomly) near the end of the sample period.
Table 1 below provides summary information across all crops in the federal crop insurance program at buyup levels (excluding CAT only coverage) in two formats. The top panel shows the actual loss performance through time along with the changing scale of the program and impact of changing farmer product use and coverage decisions through time. Note that 2012 is exceptional in its magnitude of loss and is the second largest premium total as well. The average of loss ratios across years is .95 while the total loss ratio is slightly lower at .927 as several of the larger loss rate years occurred when premiums were actually lower than average (1999-2003). The average premium gain (loss) rate is just under 5% which would be very low by commercial insurance standards, but recall that this is not competitively priced and companies are reimbursed for some of their other expenses also unlike commercial insurance markets. Premiums grew by a factor of almost 10 over the period shown, largely reflecting the higher commodity prices and extremely high acreage coverage growth from roughly 105 million to over 260 million acres over the same period.
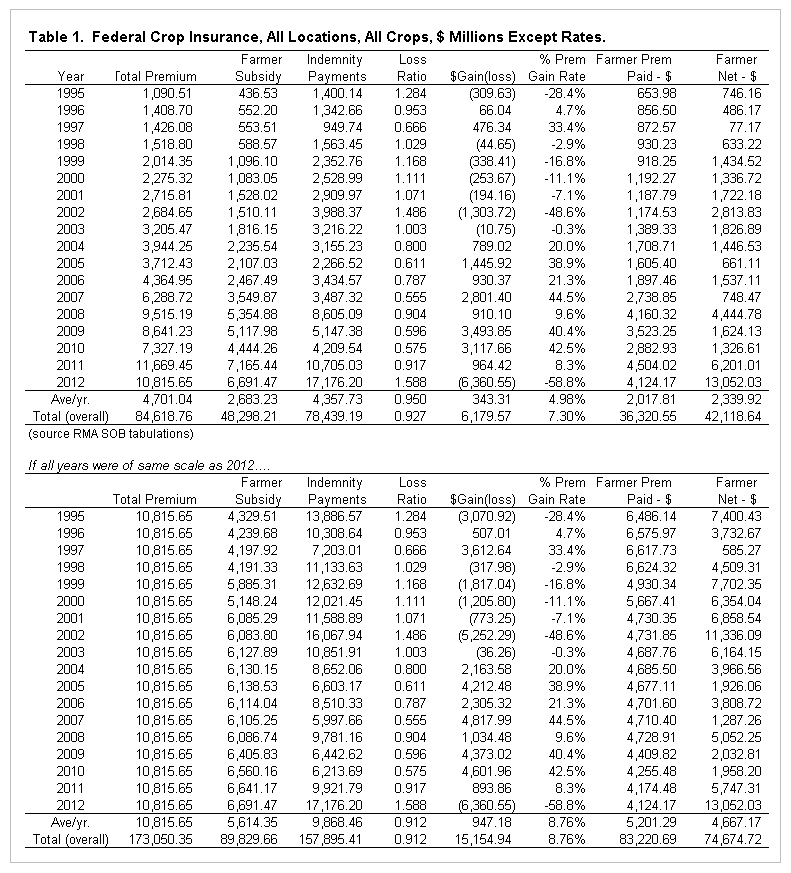
The lower panel provides a unique perspective consistent with the LCR rate making approach in which the results are simply scaled up to represent a program size for all years equivalent to 2012. Under this presentation, the averages could be interpreted as better signals for the expected performance of the program going forward under conditions (SRA, subsidy, premium, and prices level) that represent current conditions at “full coverage” acreage levels that exist today. In the lower panel of the table, the effective subsidy rates reflected in historic product selection through time were maintained so that loss ratios are equalized to actual loss ratios each year. Interestingly, this presentation suggests that the program would have actually performed slightly better than if simple averages and totals are taken from historic experiences. Moreover, it could be argued that the results are actually conservative in the sense that lower early period participation could also be reflective of additional adverse selection – or that those most likely to experience a loss were most likely to have participated so that on today’s scale, the loss rates would have been even lower.
Insurance companies would correctly point out that they do not operate in a “scale free” world, and that the actual losses of 2012 were devastating in many cases to their accumulated books of business. Moreover, companies tend to operate on regional bases, and those with disproportionate exposure in Group 1 states over recent years were disproportionately affected as well. Putting the company experience on a longer term perspective is also a difficult task as the SRA has changed substantially through time, and no company has uniform exposure across all crops. Nonetheless, it can still be instructive to examine the impact of the SRA on losses passed along to companies, and to also compare under a scale more reflective of the 2012 experience.
Table 2 below shows the 2012 allocations applied backwards through time to the loss ratios experienced in the federal crop insurance program. The Approved Insurance Providers (insurance companies, or AIPs) have to return parts of the gains to the federal government, but are also afforded reinsurance against extreme losses. Over the sample period provided, the average gain per dollar of premium was roughly 3.5% for group 1 states, and at the average loss ratios program wide, about 4.4% in group 2 states. Again, this does not reflect any particular company’s actual experience, but contrary to some suggestions, the rate of gain on premium has not been exceedingly high through time, and the variance is quite high over time ranging from -36% to about +28% in group 1 states where the majority of volume exists. Had the scale of the program been equal to 2012 through time, the performance improves only slightly as shown in the final two rows of the table, but would still not be viewed as particularly high gain rates against commercial insurance norms. Companies with recent entrance into crop insurance, and those with books of business concentrated in corn, and soybeans in the drought stricken areas were particularly hard hit and have results that are far worse in terms of post SRA loss rates.

Visit the crop insurance tools section of farmdoc on the web at: http://www.farmdoc.illinois.edu/cropins/index.asp
Disclaimer: We request all readers, electronic media and others follow our citation guidelines when re-posting articles from farmdoc daily. Guidelines are available here. The farmdoc daily website falls under University of Illinois copyright and intellectual property rights. For a detailed statement, please see the University of Illinois Copyright Information and Policies here.