


Trends in Illinois Farmland Parcel Size
The recent upswing in U.S. farmland prices is well-documented, with recent posts describing the USDA’s estimate of annual valuation change, and comparisons to other asset classes. The other key dimension of farmland sales, the amount of farmland transferred, is less frequently evaluated. This post discusses temporal and regional trends in parcel size of Illinois farmland sales from 1979 to 2011 using Illinois Department of Revenue (IDOR) farmland transfer data. To ensure the most representative collection of IDOR data, only arms-length sales of unimproved farmland classified as a farm or an empty lot were analyzed. Furthermore, only transfers between 10 acres and 1280 acres in size and between $100 and $20,000 in per-acre price were included in the data used in this analysis. These screens do limit a few potential outliers, but help provide a more realistic view of “typical” sales.
Figure 1 displays the average Illinois farmland transfer sizes from 1979 to 2011. The notable increase in parcel size transferred may reflect expansionary pressures in the agricultural sector that are a product of trends in farm technology and the economics of farming. From 1979 to 2011, the average Illinois farmland transfer size grew from 53.7 acres to 68.9 acres, an increase of 28.2 percent. Similarly, USDA data show that, from 1978 to 2012, the average Illinois farm operation size grew from 270 acres to 358 acres, an increase of 32.6 percent. Though not directly correlated, to the extent that some farm sales are “whole operations”, the increase in transferred parcel size may simply follow the natural change in operation size.
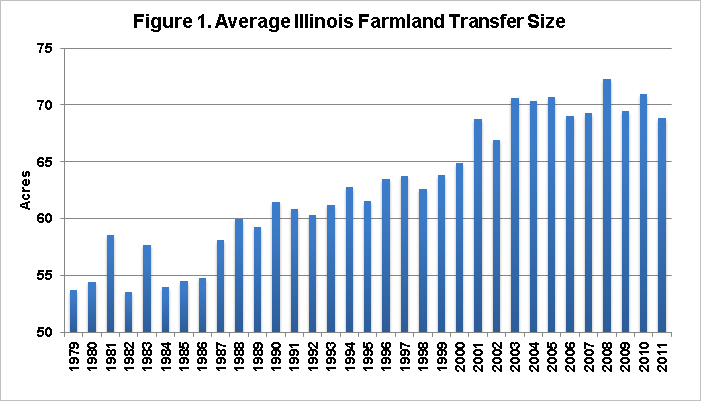
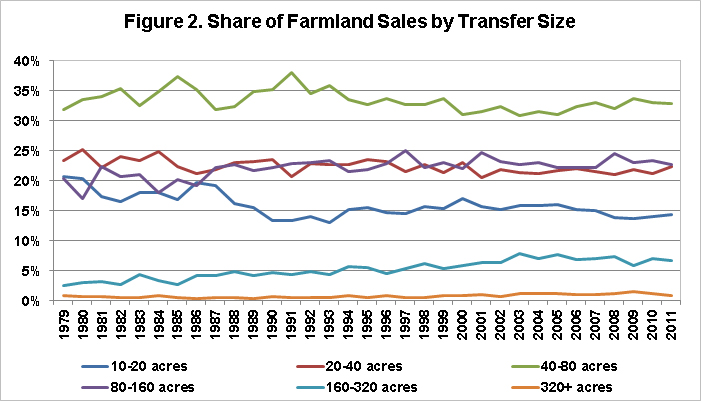
Figure 2 further delineates transfers by showing the shares of annual transfers that fall into various size categories. The shares of farmland transfers in the two largest size categories have increased through time while the shares of farmland transfers in the two smallest size categories have done the opposite. Figure 2 indicates that transfers of 40 to 80 acres have historically been very common in the Illinois farmland market, a pattern that is unchanged in recent years. Sales of 20 to 40 acres and sales of 80 to 160 acres are also relatively common. In fact, in every year from 1979 to 2011, at least 75 percent of Illinois farmland transfers were between 20 and 160 acres in size. There was a marked downturn in small (10 to 20 acre) farmland transfers from 1979 to 2011. Transfers of 10 to 20 acres decreased from 20.3 percent of all Illinois farmland transfers in 1979 to 14.4 percent of all transfers in 2011, a 30.8 percent decrease in relative activity. On the other hand, sales of 160 to 320 acres were 162.6 percent more common in 2011 than in 1979. Together, changes to the frequencies of 10 to 20 acre sales and 160 to 320 acre sales were responsible for much of the upward trend in average transfer size shown in Figure 1.
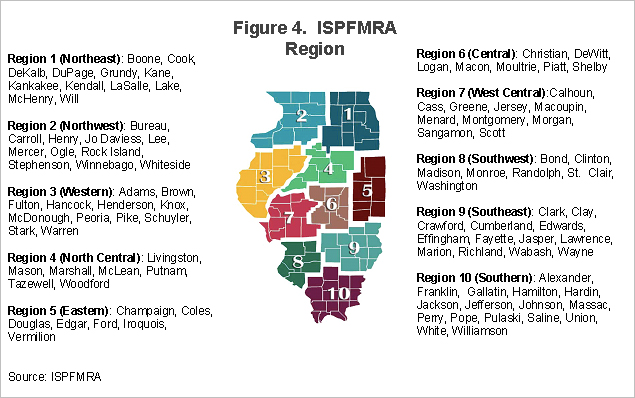
The IDOR data also allow for analysis of regional differences in farmland transfer size as well. Figure 3 breaks down average Illinois farmland transfer sizes by ISPFMRA region. (A map of ISPFMRA regions is included in Figure 4.) Figure 3 further confirms that average farmland transfer sizes have increased through time in Illinois and demonstrates that this trend exists across all regions of the state. More importantly, Figure 3 shows that a clear difference exists between farmland transfer sizes in the southern part of Illinois (the southwest, southeast, and southern ISPFMRA regions) and the remainder of the state. From 1979 to 2011, Illinois’ smallest regional average farmland transfer size came from one of the three southerly regions in all but three years. In fact, in 15 of these 33 years, average farmland transfer sizes in the southwest, southeast, and southern regions of Illinois sat below those from the state’s seven other regions. Perhaps unsurprisingly, small farmland transfer sizes in the southern part of Illinois reflect small farm sizes. According to the USDA data from 2007, average farm operation sizes in the southwest, southeast, and southern regions of Illinois were all at least 11.0 percent less than Illinois’ average farm operation size.

Importantly, parcel size has been shown to have an important relationship to farmland sale price as well. While smallest parcel farmland transfers tend to sell at greater per-acre prices than their larger counterparts, it is unclear if due to potential conversion of use potential, or reduced financial constraints that accompany small farmland parcels.
Figure 5 illustrates how Illinois farmland prices have evolved across several transfer size categories. As expected, Figure 5 shows that prices for the smallest farmland transfers (10 to 20 acres) are almost invariably the highest while prices for very large farmland transfers (320 to 640 acres) are typically the lowest. In many years, a substantial premium exists for 10 to 20 acre sales while price for other transfer size categories are clumped together relatively closely. On average, from 1979 to 2011, per-acre prices for 10 to 20 acre sales are 28.4 percent higher than those of larger parcels. Continuing up the scale, 40 to 80 acre parcels sold for only 4.4 percent more than 80 to 160 acre parcels, which in turn sold for just 6.3 percent more than 160 to 320 acre parcels. These observations are of course dependent on the characteristics that led to parcels being brought to market as well, so should not be confused as causal.

The size-price relationship for farmland transfers varies considerable by region as well, and with proximity to population in particular. In the northeast and southwest regions of Illinois (nearer Chicago and St. Louis, respectively), 10 to 20 acre parcels sell for nearly 50 percent more than other sales. Much smaller premiums exist in more rural regions where farmland buyers face less competition from buyers outside of agriculture. Across all regions, premiums for small parcels have declined in recent years as nonagricultural demand for farmland receded with the macroeconomy. Indeed, from 2007 (the year when nonagricultural demand for farmland began dropping acutely) and 2011, 10 to 20 acre parcels sold for an average of 11.8 percent more than larger parcels, far less thatn the 36% premium during the ten years prior to 2007.
The temporal and regional variation in Illinois farmland transfer sizes is in many cases a logical result of agricultural and farmland market differences within the state. Although the farmland transfer size trends discussed above are not particularly revolutionary, they are fundamentally important to understanding the past and present of the Illinois farmland market. Additional posts using the IDOR data set will continue to examine price trends and relate sales to agricultural income variation as well.
Bruce J. Sherrick, Ph.D. is the Director of the TIAA-Center for Farmland Research at the University of Illinois, and the Marjorie and Jerry Fruin Professor of Farmland Economics. Erik Hanson holds an MS from the University of Illinois and is a Ph.D. student at the University of Illinois. All opinions and any omissions or errors are the authors’ and do not necessarily reflect the views of those with whom professionally affiliated.
Disclaimer: We request all readers, electronic media and others follow our citation guidelines when re-posting articles from farmdoc daily. Guidelines are available here. The farmdoc daily website falls under University of Illinois copyright and intellectual property rights. For a detailed statement, please see the University of Illinois Copyright Information and Policies here.