


Mapping the Fate of the Farm Bill: A Closer Look at SNAP
Continuing this series examining dynamics for passing a farm bill, this post discusses one of the key issues in the current debate: the Supplemental Nutrition Assistance Program (SNAP, formerly known as food stamps). The first post examined today’s political landscape compared to the one that passed the 1996 Farm Bill. In many farm bill discussions, it is often asked why food assistance programs, such as SNAP, are included. The simple answer tends to be that it is likely impossible to pass a farm bill without SNAP but that seems unsatisfactory when SNAP has had such a prominent role in the current struggle to complete the farm bill. Complicating the matter further is the reality that many households in rural districts benefit from SNAP, yet the program’s key political support remains in urban districts.
A Brief History of the Relationship of Food Assistance to Farm Bills1
Food assistance has been connected with farm policy since the first farm bill. The Agricultural Adjustment Act of 1933 provided for the distribution of surplus commodities to low-income families along with support for commodity prices. Secretary of Agriculture Henry A. Wallace, however, created the first food stamp program in 1939 using surplus commodities to help low-income families, and it ended during World War II in 1943. Congress attached a food stamp pilot program to a foreign food aid reauthorization bill in 1959, but the administration of President Eisenhower refused to implement it. In 1961, President Kennedy’s USDA initiated a pilot food stamp program that did not use surplus commodities.
During the early 1960’s, attempts to support commodity prices through legislation had become acrimonious and politically difficult – surpluses were building at USDA, prices were depressed, and different philosophies for farm policy collided in Congress. Until the 1965 Farm Bill combined them into a single piece of legislation (which passed thanks to a deal with urban Congressmen on a separate bill favored by labor unions), farm bills of this era consisted of short-term commodity-by-commodity bills that suffered bruising political fights. Into these choppy waters waded the Food Stamp Act of 1964, but it did not get off to an easy start in the House Agriculture Committee. Retaliation against separate tobacco legislation was needed to motivate the Committee to move the bill. On the floor, House leadership saw matters differently and utilized the food stamp bill to pass a bill for cotton and wheat. The two bills were not formally linked but the votes were scheduled together; the Food Stamp Act passed first.
House Agriculture Committee members killed the 1967 reauthorization in conference, which resulted in retaliation against another bill that would have provided assistance to peanut farmers. When conference failed, the Senate passed a two-year reauthorization that was easily agreed-to in the House. This demonstrated that food stamps were capable of passing Congress on their own. Subsequently, President Johnson asked for an increase in funding at the same time the House Agriculture Committee was seeking to extend the 1965 Farm Bill for another year. Food stamp supporters from urban districts made it very clear that they would not vote for farm legislation if the House Agriculture Committee continued to fight against food stamps, causing a problem in the Committee but food stamp supporters won on the House floor and in conference with the Senate.
The farm bill and food stamps were scheduled to expire in 1970 and the House Agriculture Committee’s Chairman wanted to put them both in the same bill. The Nixon administration opposed, preferring to address food stamps with welfare. The Senate also opposed but because support for food stamps in that chamber was strong; linkage to farm legislation was seen as unnecessary and even detrimental to food stamps. They were separately reauthorized through 1973. However, the appropriations process was repeatedly used to attack both food stamps and commodity programs. For reauthorization in 1973, the House and Senate Agriculture Committees agreed to combine the programs. The Senate went first and easily passed an omnibus bill (which also included a new target price-based farm income support program), but the bill ran into trouble in the House when a deal between urban and rural lawmakers unraveled on the floor. The bill was resurrected in conference with the House agreeing to the Senate’s position on food stamps and the first omnibus farm bill with both food stamps and commodity programs passed Congress by large margins becoming the Agriculture and Consumer Protection Act of 1973.
Should There Be a Rural/Urban Divide in SNAP Support?
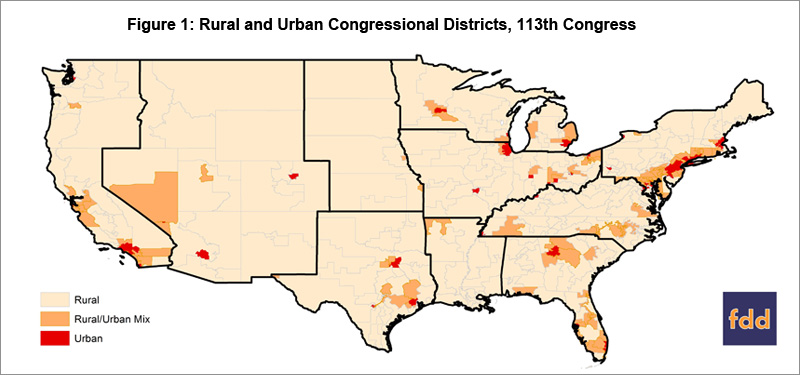
The common understanding, reinforced by the political history for these two pillars of farm bills, is that support for the programs follows participation. In other words, SNAP primarily benefits urban populations and the commodity programs primarily benefit the rural population so that their supporters in Congress align: urban districts support SNAP and rural districts support commodity programs. The starting point is sorting out which districts are rural versus urban. Figure 1 classifies the Congressional Districts of the 48 contiguous states as either urban (red), rural (pale orange), or a mix of urban and rural (dark orange). Rural districts make up much of the land base of the country with pockets of densely populated areas that contain many urban districts. The mixed districts surrounding those urban areas. As in the previous post, the USDA production regions are included.
These classifications are based on the Population-Interaction Zones for Agriculture (PIZA)2 system developed by USDA’s Economic Research Service (ERS) using 2000 population data. The ERS system provides a measure of urban and rural areas based on geographic information systems (GIS) population data of the contiguous 48 states. Data is available at a small (five-kilometer) grid cells and measures the potential interaction between urban populations and surrounding rural areas, classifying all grid cells on range from completely urban (5) to completely rural (0). Using GIS software, we calculate the average PIZA score for the districts of the 113th Congress and classify the districts using Jenks natural breaks optimization via ArcGIS. Our resulting categories are “rural” (average PIZA less than 3.0), “rural/urban mix” (average PIZA between 3.01 and 3.92), and “urban” (average PIZA above 3.93).
If SNAP is truly an urban policy, we would expect the concentration of SNAP recipients to closely follow the population map in Figure 1. However, data provided by the US Census Bureau3 suggest that many rural areas of the country have high SNAP participation rates. Figure 2 shows SNAP participation in the Congressional Districts of the 48 contiguous states and by USDA production region. Participation is measured as the percent of households receiving SNAP and is broken down into three categories. According to the U.S. Census Bureau, approximately 13.6% of all U.S. households received SNAP benefits in 2012. Those Congressional districts with participation that is below the national average rate of 13.6% are shown in white. Those districts with above-average participation (here from 13.6% to 25% of households) in SNAP are shown in orange. Finally, Congressional districts with very high participation rates – in this case more than one in four households participating in SNAP – are shown in red.
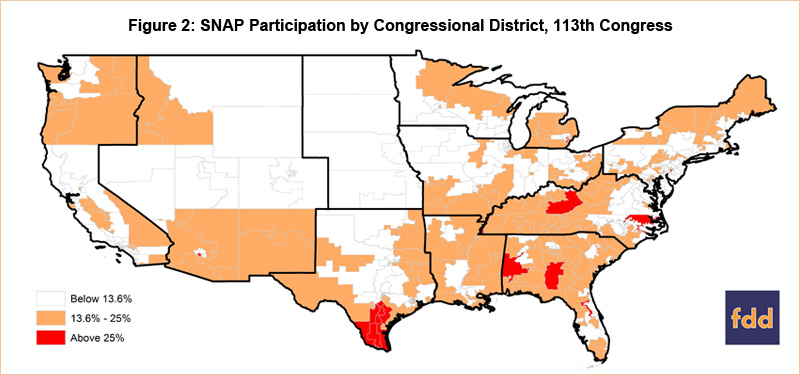
Taken together, the two maps appear to call into question the established perception that SNAP is primarily an urban program, or at least questions the political thinking that SNAP is primarily a concern for urban districts. Figure 2 demonstrates that SNAP is important to many districts classified as rural. High SNAP participation, however, may not directly suggest strong political support for the program. To get a measure of political support for SNAP, we can combine the designation of rural, urban, and rural/urban mix districts (Figure 1) with previous House voting records.
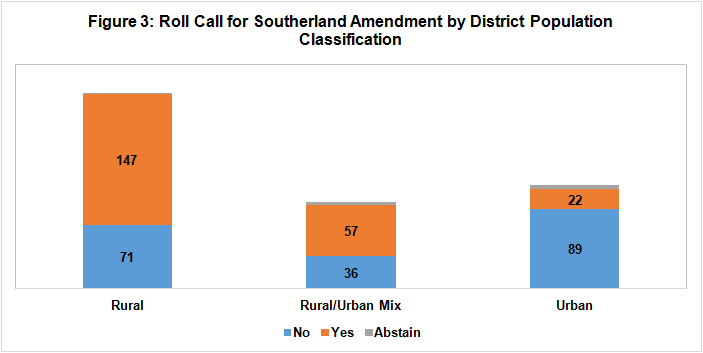
The June 20, 2013 vote in the House on the amendment offered by Representative Steve Southerland (R-FL) provides one potential measure because of the prominence it took on in the debate in the House and how it appeared to serve as a litmus test for supporting the SNAP program.4 The amendment was controversial, in part, for how it permitted or encouraged states to introduce work requirements for determining eligibility for SNAP benefits. It also has been blamed for causing the farm bill’s defeat in June. That defeat, in turn, led to the decision by House Leadership to remove SNAP, pass the remaining bill and then subsequently pass a SNAP-only bill – those votes being straight party-line votes under an even more partisan or politically-charged atmosphere. Considering the Southerland amendment a litmus test for supporting SNAP, a “no” vote on the amendment would be considered supporting SNAP and vice versa. Despite the high participation rates in many rural areas shown in Figure 2, Figure 3 shows that the majority of representatives from rural districts (67.1%) supported the amendment. In comparison, the majority of representatives from urban districts (81%) opposed the amendment.
Conclusion
The popular notion as to why food assistance programs are included in the farm bill is that they primarily benefit urban populations and in order to gain enough political support for commodity programs the farm bill must contain both. This notion is supported by the history of U.S. farm policy, but empirical evidence shows that many congressional districts with high SNAP participation rates are rural. Even though there are many constituents in rural districts who benefit from SNAP, the program’s key political support remains in urban areas.
References
1. Sources for this historical description can be found here, here and here.
2. USDA-Economic Research Service, Population-Interaction Zones for Agriculture (PIZA)
3. US Census Bureau, American FactFinder
4. Clerk, United States House of Representatives, Final Vote Results for Roll Call 284: Southerland of Florida Part B Amendment No. 102
Disclaimer: We request all readers, electronic media and others follow our citation guidelines when re-posting articles from farmdoc daily. Guidelines are available here. The farmdoc daily website falls under University of Illinois copyright and intellectual property rights. For a detailed statement, please see the University of Illinois Copyright Information and Policies here.