


Controlling Costs with Lower Crop Revenues: Cash Rents
This is the fifth in a five part series on controlling costs on grain farms. Previous posts are available here, here, here, and here.
Corn and soybean prices in 2014 are projected to be much lower than prices between 2010 and 2012. Non-land costs are not projected to come down by the same amounts as revenues have declined. As a result, current projections place operator and farmland returns below average cash rents, leading to the need to reduce cash rents.
Operator and Land Returns
Operator and land return equals gross revenue minus non-land costs, and represents a return to both the farmer and the land owner. To illustrate, take a situation where the operator and land return equals $320 per acre and farmland is cash rented for $280 per acre. In this case, the land owner receives $280 per acre in cash rent and the farmer has a return of $40 per acre ($320 operator and land return – $280 cash rent).
Figure 1 shows operator and farmland returns for northern Illinois (North), central Illinois with high-productivity farmland (Central-High), central Illinois with low-productivity farmland (Central-Low) and southern Illinois (South). These values are averaged across grain farms enrolled in Illinois Farm Business Farm Management (FBFM). As can be seen in Figure 1, operator and land returns were relatively low from 2002 through 2005, averaging $171 per acre in northern Illinois for these four years.
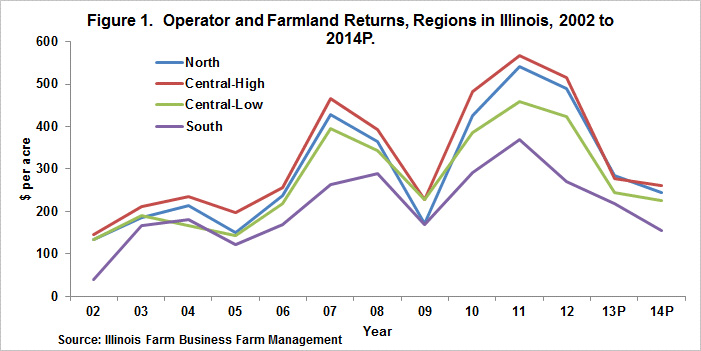
Because of higher corn and soybean prices, operator and farmland returns increased in 2007 and 2008. In northern Illinois, operator and farmland returns were $428 in 2007 and $364 in 2008. Operator and farmland returns then fell in 2009 as a result of lower commodity prices and higher costs. In northern Illinois, operator and farmland returns averaged $172 per acre in 2009. Higher levels of returns then occurred in 2010, 2011, and 2012. In northern Illinois, operator and farmland returns were $425 per acre in 2010, $540 per acre in 2011, and $490 per acre in 2012. Overall, returns have been higher between 2006 and 2012 then they were in the years prior to 2006.
Operator and farmland returns are projected to be lower in 2013 and 2014 as a result lower commodity prices. Returns in 2013 are projected at $284 per acre in northern Illinois. Prices of $4.00 per bushel for corn and $11.00 per bushel for soybeans are used in 2014 return projections. Given trend yields, operator and farmland returns are projected at $245 per acre for 2014.
Cash Rents
Since 2006, cash rents have increased dramatically in Illinois, primarily because higher commodity prices led to higher operator and land returns. To illustrate, Figure 2 shows average cash rents in Illinois. In 2006, cash rents across Illinois averaged $132 per acre. In 2013, cash rents averaged $223 per acre, an increase of $91 per acre since 2006. Between 2006 and 2013, cash rents increased an average of 7.8% per year in Illinois.

To a large extent, the cash rent increases that occurred from 2006 to 2013 period were justified. Revenues had grown and returns in agriculture were high. A portion of the higher returns needed to accrue to land owners, leading to higher cash rents.
The Current Situation: A Dilemma?
Average cash rents now are higher than 2104 projected operator and land returns. Take northern Illinois as an example. Operator and land returns averaged $486 per acre between 2010 through 2012 (see Table 1), well above average cash rents. Operator and land returns are projected at $245 per acre in 2014. Northern Illinois farmland has a 190 expected corn yield. NASS county cash rent data is used to project an average cash rent for different expected yields (see here for more detail). The average cash rent for a 190 bushel per acre expected corn yield is $286 per acre. While the $286 rent is for 2013, anecdotal evidence suggests that 2014 rents are near 2013 levels. Therefore, the 2014 cash rent likely is of the same magnitude as the 2013 cash rent. The $286 cash rent is $41 higher than the $245 operator and land return, leading to a $41 loss to the farmer.
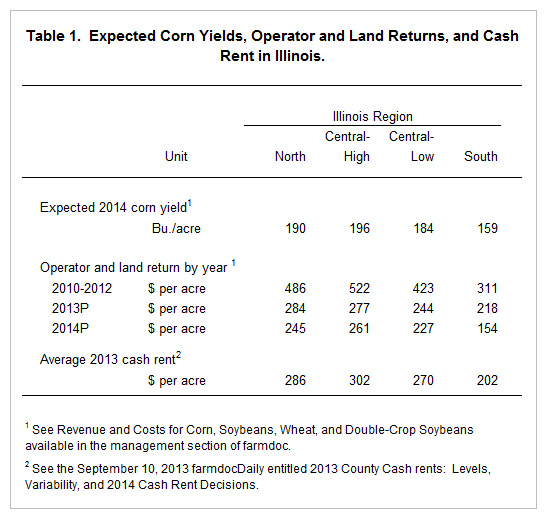
As can be seen from Table 1, projected 2014 operator and land returns are lower than average cash rents in all regions of Illinois. In central Illinois, high-productivity farmland has a $261 projected return, $42 less than the $302 cash rent. For low-productivity farmland in central Illinois, the $227 per acre return is $43 less than the $270 per acre cash rent. In southern Illinois, the $154 per acre return is $48 less than the $202 cash rent.
The 2014 projections are based on trend yields and a $4.00 per bushel corn price and an $11 per bushel soybean price. Obviously, yields and prices can change between now and harvest. All else being equal, higher prices would increase returns and lower prices would lower returns. If prices are near those used for 2014 projections; however, losses will occur on farmland rented near average rents.
Commentary
Many cash rents are set during the fall prior to the year of production. A critical time period will be this fall when 2015 cash rent levels are set. If commodity prices are near those projected above during harvest time, 2015 commodity prices likely will be projected at levels near $4 per bushel for corn and $11 per bushel for soybeans. In this case, there will be a need to adjust cash rents down for the 2015 production year.
There has been considerable debate on the speed with which cash rents will decrease in a lower return environment. The general expectation is for a long adjustment process. While rate adjustments are lagged in the farmland rental markets, there are several reasons to expect downward movements in 2015 cash rents. First, there will be two years of marginal returns to grain production: 2013 and 2014. These marginal returns will have reduced liquidity positions on many farms, leading to the need for cash rent reductions. Second, guarantees on crop insurance products will be lower, leading to a higher risk position on farms. Third, non-land costs likely will continue to be high, placing farms in a continuing high risk position. For these three reasons, the downward adjustments could occur more quickly than expected.
In this post, a $4.00 corn price is used in making projections. This is near the $3.95 price projected by the USDA at its Agricultural Outlook Forum; hence, the price expectations used here are near projections made by others. Changes in commodity prices would change return projections. For example, a $4.50 corn price and similar increase in soybean price would result an increase of $70 per acre in 2014 operator and land returns from those presented in Table 1 in northern Illinois. This $70 increase would change the return projections, resulting in positive returns to farmers. A $.50 higher corn price also would change rental outlook for 2015.
A large range in farmland returns is a characteristic of the current environment. As corn prices from $3.50 and $5.50 per bushel are possible, swings of $200 or more in operator and land returns will over the next several years. In this environment, it will be difficult for land owners not to bear some of the return declines. Similarly, land owners will want to take part when higher returns occurs. This risk sharing will require adjusting cash rents up or down based on price, cost, and yield expectations. Those land owners willing to bear this risk likely will be rewarded with higher returns over time.
Summary
This series has addressed adjusting costs to a lower revenue environment. A lower revenue environment will require re-evaluating input decisions and lowering capital purchases. These reactions likely will not be enough to lower costs by the same magnitude as revenue declines. As a result, cash rents will need to be adjusted down. This will especially need to occur if $4.00 or lower corn prices persist over the several years. At these price levels, current levels of average cash rents result in loses to farmers.
Disclaimer: We request all readers, electronic media and others follow our citation guidelines when re-posting articles from farmdoc daily. Guidelines are available here. The farmdoc daily website falls under University of Illinois copyright and intellectual property rights. For a detailed statement, please see the University of Illinois Copyright Information and Policies here.