


Understanding Crop Year Price Changes in Estimating PLC Payments
Overview
The 2014 farm bill provides a choice between a Price Loss Coverage (PLC) program and an Agricultural Risk Coverage (ARC) program. The choice is not a 1 year decision; it is a 5-year decision. This post therefore examines one potential price behavior that may occur over multiple crop years. It suggests a simple method for estimating PLC payments. Results of this study should be used as an illustration of the strategic thinking that needs to occur regarding this 5-year decision.
Data
This study uses the average price for the 1974 through 2006 crop years and the current estimate for the 2013 crop year for barley, corn, oats, rice, sorghum, soybeans, and wheat. The historical prices are from the U.S. Department of Agriculture (USDA), National Agricultural Statistics Service (NASS) Quick Stats database (see here). The 1974-2006 period is used because prices fell within a range that was stable and trended neither up nor down. These characteristics are desirable when examining the behavior of price. The crops chosen for analysis are historically important farm program crops. Peanuts are not included because, until the 2002 farm bill, peanut prices were strongly influenced by a marketing quota program. It is unlikely that the behavior of peanut prices prior to 2002 is relevant to the future behavior of peanut prices. Prices for the current 2013 crop year are from USDA’s April 2014 World Agricultural Supply and Demand Estimates Report (WASDE) (see here).
Persistence of Price Change
The behavior of prices is usually investigated by examining the characteristics of change in price. Change is commonly measured as percent change. The change of interest in this study is the percent change in price between crop years. A potential multiple-year price behavior characteristic that is of interest is whether price change, especially large price change, may persist to some degree across crop years. A reason price change may persist is the well-known inelastic short-term supply and demand for most crops. Inelastic supply and demand means that the percent change in price exceeds the percent change in quantity supplied by producers or demanded by consumers. Thus, while consumers and producers will respond to changes in price, the short term response in quantity is usually less than the percent change in price.
A simple, initial investigation of potential price persistence was conducted. To illustrate the investigation, the percent change in corn price from the 1980 to 1982 crop year was compared with the percent change in corn price from the 1980 to 1981 crop year. All such comparisons were compiled for a crop. The resulting data set was examined using regression analysis. The slope coefficients from the regressions are presented by crop in Figure 1. Each slope coefficient differs from zero at the 95% level of statistical confidence. The slope coefficient is interpreted as follows: for corn, a 1% decline in corn price from last crop year to the current crop years is associated with a 0.9% decline in corn price from last crop year to the upcoming crop year. For soybeans, the slope coefficient of 0.68% means that a 1% decline in soybean price from last crop year to the current crop year is associated with a 0.68% decline in soybean price from last crop year to the upcoming crop year. Thus, a decline in both corn and soybean price from last year to the current year persisted into the next crop year, but the amount of decline was somewhat smaller, especially for soybeans.

Figure 1 suggests that persistence of past price change into the next crop year may be a common price behavior of the selected program crops. For barley and especially wheat the price change tended to become even larger in the next crop year. However, for most of the crops as well for the average of all crops, slope was less than 1, implying that the change in price moderated in the next crop year. This moderation is consistent with a price process that economists call mean reversion. A mean reversion process implies that price will return to its mean value, or average over time after an extreme price change.
A Simple Estimation Method for PLC Payments
The preceding discussion implies that understanding price behavior over multiple years is different than understanding price behavior within and between crop years due to the potential for persistence in price changes across multiple years. Historically, prices have followed a specific path that reflected the interplay of various price behavior characteristics. Because these price behavior characteristics have occurred in the past, they may repeat themselves in the future.
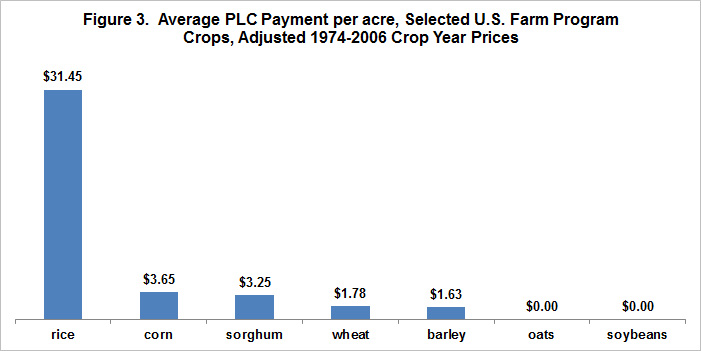
This observation suggests a simple forecasting method: use the historical price paths to forecast future price behavior. However, current prices are notably higher than prices during 1974-2006. A simple adjustment mechanism is to increase each 1974-2006 crop year price by the ratio of the USDA estimate of the current crop year price to the average 1974-2006 price. To illustrate, USDA’s current estimate of the 2013-2014 corn price is $4.60/bushel. The average 1974-2006 crop year price is $2.37/bushel. Hence, each 1974-2006 crop year price is multiplied by 1.94 ($4.60 divided by $2.37). These adjusted crop year prices were then compared with the PLC reference price, with payments occurring when the adjusted price was less than the PLC reference price. Figure 2 presents the share of years that PLC made a payment while Figure 3 presents the average per acre PLC payment. This payment rate calculation includes the program parameter that PLC payments are received for only 85% of payment acres. The base yield update option is used, so payment yield is 90% of average U.S. yield for the 2008-2012 crop years.
Estimated per acre payments are less than $5 per acre for all crops except rice. Average per acre payment for rice is $31. The low estimated average payments reflect a number of factors, but the most important is probably that the current 2013 crop year price is relatively high compared with the PLC reference price for all crops. The range was 18% for sorghum to 55% for soybeans. Barley, corn, rice, and wheat were all between 20% and 25%.

Summary Thoughts
This study uses a simple analysis and a small data set. Additional studies are needed, including additional studies of longer periods of persistence. Thus, it is important to not put too much emphasis on any individual estimate. Nevertheless, the study does suggest several insights into the ARC-PLC decision.
- Since the ARC-PLC decision is a 5 year decision, the issue is not the behavior of prices within a crop year or between crop years, but the behavior of prices over 5 years. This study specifically raises the issues of potential persistence of price change over multiple crop years, and what this price behavior characteristic may imply for the management of multiple year price risk.
- Thus, estimated PLC payments depend critically on the characteristics of multiple-year price behavior. Estimated PLC payments also depend critically on the initial starting price. Different characteristics of multiple-year price behavior and different starting prices will generate different PLC payment estimates.
- In the past, most of the management of multiple-year price and revenue risk for crops and dairy was provided by the government through its provision of a single program that established a floor under ether price or revenue per unit. By providing a choice, the 2014 farm bill puts part of the management of multiple year price and revenue risk of crops into the hands of farmers. Thus, the 2014 farm bill provides an incentive and an opportunity for farmers and their advisors to learn about multiple year risk management options and perspectives. These perspectives include consideration of price behavior characteristics over multiple crop years.
- The Farm Service Agency (FSA) provided farmers a valuable decision by postponing the sign up window for the 2014 farm bill decision to late 2014 and maybe into 2015. Not only will farmers have reasonably good ideas of 2014 crop year prices, but, depending on what happens between now and the end of sign up, they may also have insights into price behavior during the 2015 and possibly later crop years, depending upon additional investigations of multiple year price behavior. In short, farmers should thank FSA for the decision to postpone sign-up.
- This publication is also available at http://aede.osu.edu/publications.
Disclaimer: We request all readers, electronic media and others follow our citation guidelines when re-posting articles from farmdoc daily. Guidelines are available here. The farmdoc daily website falls under University of Illinois copyright and intellectual property rights. For a detailed statement, please see the University of Illinois Copyright Information and Policies here.