


Why Is the Price of Biodiesel RINs Plummeting?
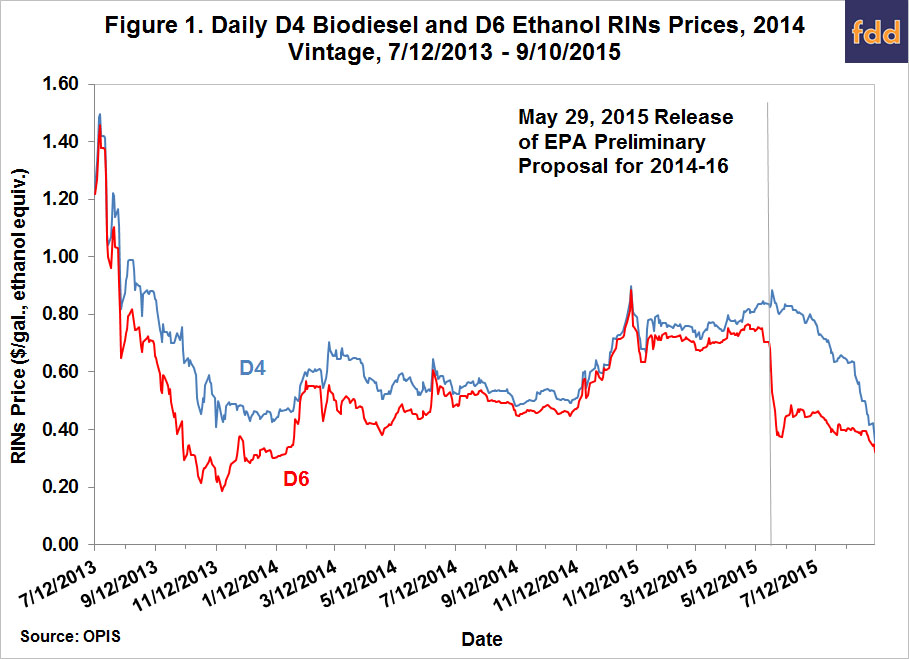
After the EPA issued its long-awaited proposal for the 2014, 2015 and 2016 RFS mandates on May 29, 2015, the price of D4 biodiesel RINs increased slightly while the price of D6 ethanol RINs dropped precipitously (Figure 1). The relatively small increase in D4 prices after the announcement suggested that the biomass-based diesel mandates were largely as expected, but the sharp drop in D6 prices indicated that the ethanol mandates were smaller than many expected (farmdoc daily, June 3, 2015). After falling sharply in the days following the EPA announcement, D6 RINs prices have since generally traded in a sideways fashion. In contrast, after rising slightly in the days following the announcement, D4 RINs prices have declined at an ever increasing rate, to the point where D4 and D6 prices today differ by only a few cents. The behavior of D4 prices in recent weeks appears to be quite puzzling given the lack of additional important RFS announcements by the EPA. Furthermore, since the RINs price represents the marginal cost of complying with an RFS mandate, it is important to understand why any large change in the RINs price occurs. It turns out that the seemingly anomalous behavior of D4 biodiesel RINs prices actually has a fairly straightforward explanation based on the behavior of two of the key drivers of biodiesel RINs prices–soybean oil prices and the biodiesel tax credit. The conceptual model of the biodiesel market that we have employed in several previous farmdoc daily articles on the pricing of RINs and implementation of the RFS (e.g., October 10, 2014; October 15, 2014; May 28, 2015; July 22, 2015; August 5, 2015) provides the starting point for the analysis.
Conceptual Model
The conceptual model presented in Figure 2 represents the supply of biodiesel producers and demand from diesel blenders at the wholesale level. Retail demand at the consumer level is implicitly represented by a simple percentage markup of the wholesale demand shown in Figure 2. The model also assumes that biodiesel demand is perfectly elastic (horizontal) for biodiesel prices equal to ultra low sulfur diesel prices. This reflects an assumption that biodiesel and diesel are perfect substitutes and that biodiesel is a small enough part of the diesel market that changes in the biodiesel price do not impact the overall demand for diesel fuel. One could go further and adjust biodiesel prices to reflect the lower energy content of biodiesel (about 12% lower) compared to petroleum diesel. However, given the low biodiesel blends typically used in the marketplace today (e.g., B2 or B5), it is doubtful that this lower energy content is priced at the retail level. Furthermore, a growing portion of “biodiesel” consumption in the U.S. is in the form of renewable diesel that has the same energy content as petroleum diesel (farmdoc daily, December 13, 2013). So, we assume no adjustment is necessary for energy content. The supply of biodiesel producers is represented by a standard upward-sloping function that reflects increasing marginal costs as production expands. Note that supply is assumed to reflect domestic conventional biodiesel and renewable diesel production as well as net imports (imports – exports).

The biodiesel market is shown in Figure 2 with a volume mandate. The mandated quantity (Q2M) is assumed to substantially exceed the small amount of biodiesel that would be produced absent the mandate (Q1*), so the mandate is said to be “binding.” In order to incentivize the higher production, biodiesel producers must be paid a price that is higher (Pbd) than the wholesale diesel price (Pulsd). From the perspective of a diesel blender, there is a wedge between the price paid to biodiesel producers and the price charged to retailers (consumers) for the biodiesel in diesel blends. This wedge, or loss, is the wholesale diesel price minus the biodiesel price at the mandated quantity. The wedge also equals the “wet” price of a D4 biodiesel RINs in this model. The “wet” terminology is used because a gallon of physical (wet) biodiesel generates 1.5 ethanol equivalent RINs under RFS rules. In more formal policy terms, the wet RINs price is the marginal cost of requiring a level of production and consumption above the market equilibrium (Q1*). While this cost is initially borne by diesel blenders, the cost is assumed to be fully passed on to diesel consumers in the form of higher retail prices for diesel (weighted appropriately for the proportion of the blend that is biodiesel). So, diesel consumers ultimately bear the cost of the binding volume mandate.
The biodiesel market shown in Figure 3 considers both a volume mandate and a blender tax credit. The mandate is still binding because it is assumed to require a higher level of production than under a tax credit alone (Q2M>Q2*). From the perspective of a diesel blender, the wedge between the price paid to biodiesel producers and the price charged to retailers (consumers) for the biodiesel in diesel blends is reduced by exactly the amount of the tax credit. Since the wedge is equal to the wet RINs price in this model, the RINs price is reduced by the amount of the tax credit. As noted above, the cost of complying with the volume mandate is ultimately reflected in higher retail diesel prices. The credit partially offsets this cost to consumers by reducing diesel prices. In other words, the cost passed on to consumers is lowered by the amount of the tax credit and the total cost of compliance is shared between taxpayers and diesel consumers.

The conceptual model presented in Figure 3 highlights the key variables that determine the price of a D4 biodiesel RINs. The D4 price will vary directly with the steepness (slope) and position (intercept) of the biodiesel supply curve. For example, a parallel downward shift in the supply curve will reduce the RINs price. The wholesale price of diesel shifts the demand curve up or down and all else constant, will change the RINs price accordingly. For example, if the price of diesel declines this will shift the demand curve down and the price of RINs will increase. The blender tax credit shifts the demand curve up and reduces the RINs price, while the level of the RFS mandate determines the points of intersection with the supply and demand curves.
Another insight provided by the conceptual model relates to the direction of causality between feedstock and biodiesel prices. Since feedstock costs make up over 80 percent of the variable operating costs for a representative biodiesel plant (see the farmdoc daily article on March 19, 2014 for details), the price of feedstock is the main driver of shifts in the biodiesel supply curve. Figure 4 shows the same conceptual model of the biodiesel market as before except the supply curve is allowed to shift up or down based on the price of feedstock. Specifically, supply curve 1 is considered the base case, supply curve 2 shifts down to reflect a lower feedstock price, and supply curve 3 shifts up to reflect a higher feedstock price. In this model, so long as the drop in feedstock price does not shift the supply curve to the right of curve 3, shifts in the supply curve completely determine the price of biodiesel paid to producers. Demand shifts do not impact the biodiesel price under these conditions because the mandate volume is binding regardless of the level of demand. The interesting result is that feedstock prices drive, or “cause,” biodiesel prices through supply shifts. It is important to emphasize that this result does not imply the volume mandate has no impact on biodiesel prices. If the volume mandate is increased or lowered, given a particular supply curve, biodiesel prices will obviously adjust up or down. So, it is more precise to state that feedstock prices drive biodiesel prices through supply shifts for a given level of the volume mandate.

Empirical Analysis
With the insights gained from the conceptual model, the drivers of plummeting D4 biodiesel RINs prices in recent weeks can be analyzed. We start by examining trends in soybean oil prices and biodiesel prices. Soybean oil is the main feedstock used to make biodiesel in the U.S. and biodiesel prices, all else constant, are directly related to D4 biodiesel RINs prices. Figure 5 plots the weekly soybean oil and biodiesel price at Iowa plants from January 26, 2007 through September 4, 2015. It is readily observed that, outside of the two obvious spikes, that soybean oil and biodiesel prices at the plant are highly correlated. For example, the correlation of the two weekly prices over 2014 and 2015 is 0.93. In terms of the two seemingly anomalous spikes, we have argued in previous farmdoc daily articles (for example, September 25, 2013) that biodiesel prices were pushed up substantially above breakeven levels due to diesel blenders racing to take advantage of the tax credit before it expired. Both soybean oil and biodiesel prices have declined sharply since early June 2015, with soybean oil dropping from $0.35 to $0.26 per pound and biodiesel dropping from $3.30 to $2.57 per gallon.

As anyone who has taken an introductory statistics course knows, “correlation does not necessarily imply causation,” so we cannot simply assume that the recent decline in biodiesel prices, which would push down the price of D4 RINs, is due to the decline in soybean oil prices. The conceptual model suggests that the direction of causality runs from soybean oil prices to biodiesel prices under certain conditions, but empirical evidence that confirms this prediction is needed before we can confidently reach this conclusion. Fortunately, which series leads the other can be tested using a statistical procedure called “Granger causality.” This procedure is based on a regression of variable Y on its own lagged values and the lagged values of the variable X and a regression of variable X on its own lagged values and the lagged values of Y. If lagged values of X are significant in the Y regression but lagged values of Y are not significant in the X regression, than it can be concluded that variable X leads, or “Granger causes,” variable Y.
Standard Granger causality regressions were estimated using the weekly soybean oil and biodiesel prices data over January 2, 2014 – September 10, 2015, with the following results:

where BD(t) is the biodiesel price in current week, BD(t-1) is the biodiesel price in the previous week, SO(t) is the soybean oil price in current week, and SO(t-1) is the soybean oil price in the previous week. The figures in parentheses are t-statistics, with a value approximately greater than two in absolute value indicating statistical significance. It is no surprise that previous week’s price of biodiesel is significantly related to this week’s biodiesel price and the previous week’s price of soybean oil is significantly related to this week’s soybean oil price. The interesting results are generated by the cross-product terms. In particular, the previous week’s soybean oil price is significantly related to this week’s biodiesel price in the first regression, while last week’s biodiesel price is not significantly related to this week’s soybean oil price in the second regression (estimating the regressions using price changes rather than price levels results in the same conclusion). This means that soybean oil prices lead, or “Granger Cause,” biodiesel prices but biodiesel prices do not lead soybean oil prices. In practical terms, this means that soybean oil prices drive biodiesel prices over a weekly horizon, just as predicted by the conceptual model in the previous section. One must be careful to not generalize these results too far, however. It is still possible for biodiesel prices to influence soybean oil prices over longer time horizons, such as a quarter or a year. For example, a large increase in the RFS biodiesel mandate, like that announced in May, could imply a big enough increase in demand for biodiesel and soybean oil that the price of soybean oil increases. Since changes of this magnitude happen relatively infrequently, this feedback effect of biodiesel prices on soybean oil prices will be swamped over a weekly horizon by much more frequent changes in other variables. Regardless, the dominant driver of biodiesel prices at the plant level in the short-run is clearly the price of soybean oil, and we can confidently state that the recent decline in biodiesel prices from $3.30 to $2.57 per gallon has been driven almost exclusively by the decline in soybean oil prices from $0.35 to $0.26 per pound.
Having nailed down the relationship between soybean oil and biodiesel prices, the next step in our analysis is to compare the trends in biodiesel and diesel prices, which determine the blending margin for biodiesel. Figure 6 shows weekly wholesale prices of biodiesel and (ultra low sulfur) diesel at Chicago from January 25, 2007 through September 10, 2015. Diesel prices during 2015 have moved sideways in a range from about $1.40 to $2.00 per gallon. Since early June, diesel prices have dropped from around $1.85 to $1.60 per gallon. As noted above, driven by declining soybean oil prices, biodiesel prices have declined rather sharply since early June, about $0.70 per gallon. The net effect, shown in Figure 7, has been to narrow “wet” biodiesel blending losses since early June by about $0.40 per gallon in recent weeks (drop in diesel prices increases blending losses and offsets part of the narrowing associated with the drop in biodiesel prices). This has driven blending losses close to the historically significant level of -$1 per gallon. Losses as recently as mid-July have been as large as -$1.50 per gallon.


Since the conceptual model in the previous section showed that the price of D4 biodiesel RINs is a function of the blending margin for biodiesel (ignoring time value), the next step of the analysis is to compare these two series. Figure 8 shows the biodiesel blending margin at the wholesale level in Chicago and the D4 RINs price. As before, the blending margin is presented on a weekly basis from January 25, 2007 through September 10, 2015. The available data on D4 prices does not begin until September 3, 2009. Also, note that the D4 RINs prices shown in Figure 8 are not the same as in Figure 1. Prices for “current year” vintage RINs are shown in Figure 8, while Figure 1 presents only 2014 vintage RINs prices. The blending margin shown in Figure 8 is the same as in Figure 7 except the margin in Figure 8 is: i) adjusted for the $1 per gallon tax credit when it is in place (2007-2009, 2011, 2013); multiplied by -1 to facilitate comparison to the market price of D4 RINs; and iii) divided by 1.5 in order to convert the margin from physical (wet) units to ethanol equivalent units. As expected, D4 prices track the movement of blending margins reasonably closely.

While there is a generally high correlation between the blending margin and D4 prices, there have been periods when the two series diverge considerably. The last three months represent one of those times. Since mid-June, the D4 RINs price has declined from $0.91 to $0.39 per gallon, or a price drop of $0.52. Over the same time period, the blending margin in ethanol equivalent terms has declined from $0.98 to $0.73 per gallon, a decline of $0.25. So, the decline in D4 prices since mid-June is slightly more than twice the decline in the blending margin. What explains this discrepancy? The most likely explanation is that RINs traders have been revising upward their estimates of the chance that the biodiesel tax credit will be reinstated for 2015. The blending margins for 2015 shown in Figure 8 assume the $1 per gallon blender credit is not in place. If a trader believes there is a high probability of the credit being reinstated retroactively for 2015, it would be rational to reduce the valuation of a D4 RINs by as much as $0.67 per gallon ($1/1.5). The logic for doing this is provided by the conceptual model presented in the previous section, which clearly demonstrates that a tax credit reduces the RINs price when there is a binding volume mandate.
There have indeed been important developments over the summer with regard to reinstatement of the biodiesel tax credit. As discussed in these two recent farmdoc daily articles (July 22, 2015; August 5, 2015), the U.S. Senate Finance Committee approved a bill reinstating the tax credit for 2015 and extending it through 2016. While the bill has to be passed by the U.S. House of Representatives and signed by the President to become law, the Senate Committee action provides a strong signal of political support for the biodiesel tax credit, and this has most likely filtered into the valuation of D4 RINs. This same dynamic has been repeated in the RINs market when the tax credit expired for 2010, 2012, and 2014, but was then subsequently reinstated. The revision in RINs trader beliefs about reinstatement of the tax credit is evident in the changing relationship between blending margins and D4 RINs prices shown in Figure 8 for these years. A more detailed discussion of this phenomenon can be found in the farmdoc daily article from October 10, 2014.
Implications
The price of D4 biodiesel RINs has fallen by over 50 cents per gallon since mid-June. This is a large drop in price both in absolute and relative terms, and since the RINs price represents the marginal cost of complying with an RFS mandate, it is important to understand why any large change in the RINs price occurs. The first factor contributing to the decline in D4 biodiesel RINs prices is the price of soybean oil, which is the main feedstock used to make biodiesel in the U.S. The price of soybean oil has fallen about 7 cents per pound since mid-June due to improving soybean production prospects in the U.S. and concerns about economic growth in China. With a binding volume mandate, soybean oil prices are the main determinate of biodiesel prices, so the decline in soybean oil prices has led to a decline of more than 60 cents in the price of biodiesel. In turn, the decline in biodiesel prices has been the main factor in narrowing the biodiesel blending margin by about 25 cents. Since the biodiesel blending margin, at least in theory, is equal to the RINs value (ignoring time value), we are left with the puzzling result that the decline in D4 RINs prices is slightly more than twice the size of the decline in biodiesel blending margins. The most likely explanation for this puzzling result is that traders have been revising upward their estimate of the chance that the biodiesel tax credit will be reinstated for 2015. Since a tax credit reduces the RINs price when there is a binding volume mandate, it is rational to reduce D4 prices sharply if traders perceive a high chance of the credit being reinstated. Recent activity in the U.S. Senate is consistent with such an expectation.
References
Granger causality. In Wikipedia. Last modified on August 5, 2015, at 12:47, and retrieved September 11, 2015, from https://en.wikipedia.org/wiki/Granger_causality
Energy content of biofuel. In Wikipedia. Last modified on June 12, 2015, at 11:34, and retrieved September 11, 2015, from https://en.wikipedia.org/wiki/Energy_content_of_biofuel
Environmental Protection Agency. "Renewable Fuel Standard Program: Standards for 2014, 2015, and 2016 and Biomass Based Diesel Volume for 2017; Proposed Rule." Federal Register 80(111), June 10, 2015. http://www.gpo.gov/fdsys/pkg/FR-2015-06-10/pdf/2015-13956.pdf
Irwin, S. "Implications of Changing the Biodiesel Tax Credit from a Blender to a Producer Credit." farmdoc daily (5):142, Department of Agricultural and Consumer Economics, University of Illinois at Urbana-Champaign, August 5, 2015.
Irwin, S. "Why Do Blenders Share Retroactively Reinstated Tax Credits with Biodiesel Producers?" farmdoc daily (5):133, Department of Agricultural and Consumer Economics, University of Illinois at Urbana-Champaign, July 22, 2015.
Irwin, S. "Clues from the RINs Market about the EPA's RVO Proposals for 2014, 2015, and 2016." farmdoc daily (5):98, Department of Agricultural and Consumer Economics, University of Illinois at Urbana-Champaign, May 28, 2015.
Irwin, S. "Pricing of 2014 Biodiesel RINs under Alternative Policy Scenarios." farmdoc daily (4):199, Department of Agricultural and Consumer Economics, University of Illinois at Urbana-Champaign, October 15, 2014.
Irwin, S. "Understanding the Behavior of Biodiesel RINs Prices." farmdoc daily (4):196, Department of Agricultural and Consumer Economics, University of Illinois at Urbana-Champaign, October 10, 2014.
Irwin, S. "Recent Trends in the Profitability of Biodiesel Production." farmdoc daily (4):51, Department of Agricultural and Consumer Economics, University of Illinois at Urbana-Champaign, March 19, 2014.
Irwin, S. "Estimating the Biomass-Based Diesel Supply Curve." farmdoc daily (3):237, Department of Agricultural and Consumer Economics, University of Illinois at Urbana-Champaign, December 13, 2013.
Irwin, S. "Biodiesel Supply Response to Production Profits." farmdoc daily (3):182, Department of Agricultural and Consumer Economics, University of Illinois at Urbana-Champaign, September 25, 2013.
Irwin, S. and D. Good "The EPA's Proposed Ethanol Mandates for 2014, 2015, and 2016: Is There a 'Push' or Not? " farmdoc daily (5):102, Department of Agricultural and Consumer Economics, University of Illinois at Urbana-Champaign, June 3, 2015.
Disclaimer: We request all readers, electronic media and others follow our citation guidelines when re-posting articles from farmdoc daily. Guidelines are available here. The farmdoc daily website falls under University of Illinois copyright and intellectual property rights. For a detailed statement, please see the University of Illinois Copyright Information and Policies here.