


ARC-CO and PLC Payment Indicators for 2015 Crop Year, October WASDE
This article presents 2015 national payment indicators for ARC-CO and PLC for barley, corn, oats, long grain rice, peanuts, sorghum, soybeans, and wheat. Except for peanuts, the estimates are based on prices and yields in the October 9, 2015 World Agricultural Supply and Demand Estimates (WASDE). The term, payment indicator, is used because notable uncertainty surrounds 2015 prices and yields. U.S. yields are used; thus, the indicators are not estimates of individual FSA farm payments. Nevertheless, they provide an early perspective on 2015 program payments. Crop year 2015 payments will not be made until after October 1, 2016. The payment indicators do not include the 6.8% sequestration cut that have been announced for 2014 and 2015 farm program payments.
Calculation of Payment Indicators
ARC-CO makes a payment if county revenue is below 86% of the county’s benchmark revenue. Benchmark revenue is obtained by multiplying 5-year Olympic moving averages (removes high and low values) of county yield and U.S. crop year price. ARC-CO payments are capped at 10% of the benchmark revenue. PLC makes payments when U.S. crop year average price is less than the crop’s reference price. The reference price was specified by Congress in the 2014 farm bill. The payment indicators reflect that ARC-CO and PLC make payments on 85%, not 100%, of program base acres.
Peanuts are not reported in WASDE. The U.S. yield estimate for peanuts is from the U.S. Department of Agriculture’s October Crop Production report. Estimates for 2014 crop year low, mid, and high prices are obtained using a regression equation estimated as average crop year price vs. the price reported by the National Agricultural Statistics Service for August, the first month of the peanut crop year. The analysis covers the 2004 – 2014 crop years. Explanatory power of this regression equation is 66%. The low and high price is minus and plus 1 standard error of the regression equation.
U.S. per acre Payment Indicator for 2015 Crop Year
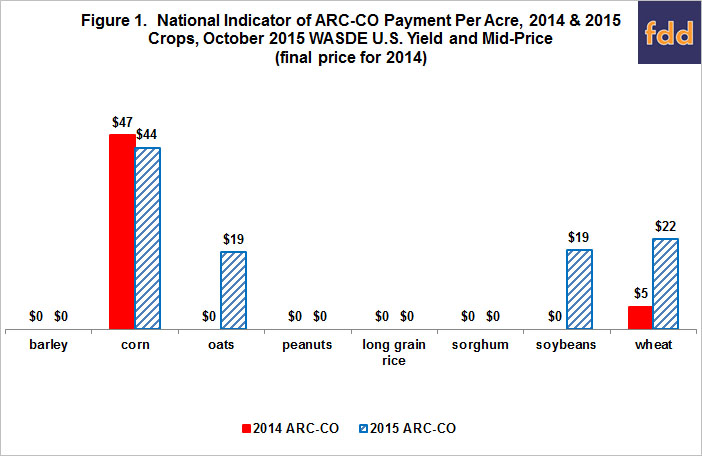
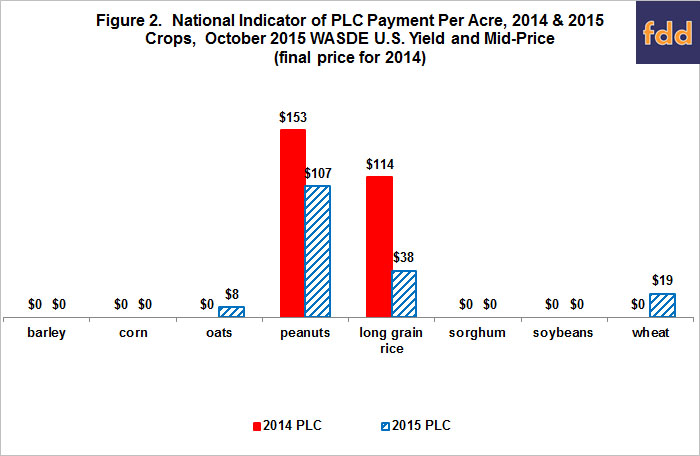
Table 1 contains the October 2015 WASDE price projections for the 2015 crop year. Using the mid-price projections, ACR-CO payments are indicated for corn, oats, soybeans, and wheat (see Figure 1) and PLC payments are indicated for oats, peanuts, long grain rice, and wheat (see Figure 2). The figures also contain the U.S. indicated per acre payment for the 2014 crop, which is estimated using the U.S. yield and U.S. final crop year price in the October 2015 WASDE and crop production reports. Oats and soybeans have indicated ARC-CO payments for 2015 but not for 2014. Oats and wheat have indicated PLC payments for 2015 but not for 2014. ARC-CO corn, PLC peanuts, PLC long grain rice, and ARC-CO wheat have indicated payments in both years. Oats and wheat are the only crops with indicated payments from both programs at the mid-price projections.

Range of U.S. per acre 2015 Payment Indicator
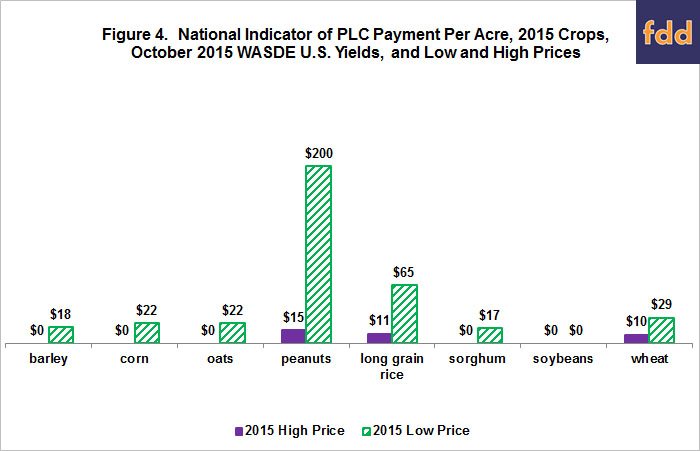
Considerable uncertainty exists regarding the size and even occurrence of 2015 payments for most program crops. If the 2015 crop year price ends up at the low price, barley and peanuts also have ARC-CO payments indicated while barley, corn, and sorghum also have PLC payments indicated (see Figures 3 and 4). The materially higher ARC-CO payments for corn and soybeans at the low price than mid-price projection suggest the relationship between 2015 yield and 2010-2014 Olympic average yield will be an important determinate of 2015 ARC-CO payments for these crops. At the high price projection, ARC-CO payments are indicated for corn, oats, and wheat while PLC payments are indicated for peanuts, long grain rice, and wheat. However, per acre payment indicators for these crops are much lower at the high price than mid-price projections. Because ARC-CO is a revenue program while PLC is a price program, higher prices reduce PLC payments more than ARC-CO payments. On the other hand, given a price below the reference price, higher 2015 yields will reduce ARC-CO payments but not affect PLC payments.

Potential Total 2015 Crop Year Payments
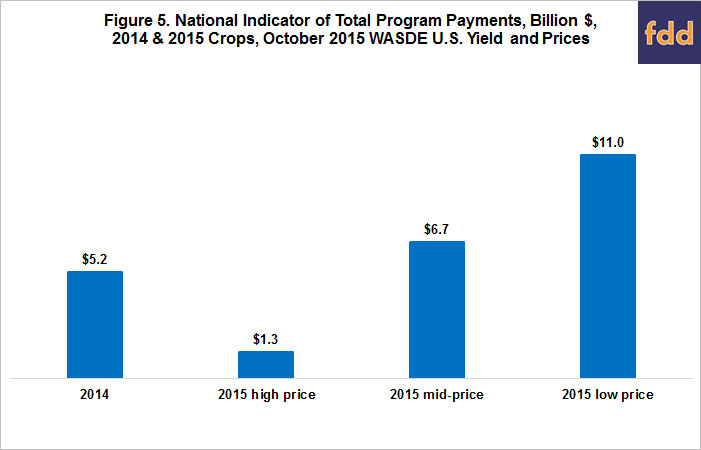
Using the U.S. base acres reported by the Farm Service Agency as having elected ARC-CO and PLC and average PLC yield for those farms that both elected PLC and updated program yields, indicated payments for the program crops included in this analysis total $6.7 billion (see Figure 5). This amount is 29% higher than the $5.2 billion of 2014 indicated total U.S. payments. The increase primarily reflects indicated ARC-CO payments for 2015 soybeans, higher indicated ARC-CO payments for 2015 wheat, and indicated PLC payments for 2015 wheat. Also noteworthy is the range of indicated total payments: — from $1.3 billion if all prices end up at the high end to $11.3 billion if all prices end up at the low end.
Summary Observations
- Most of the examined program crops are in the revenue or price zone in which payments can range from zero to large.
- As of October 11, 2015, ARC-CO payments are most likely for 2015 corn, oats, soybeans, and wheat. PLC payments are most likely for 2015 peanuts, long grain rice, and wheat.
- Yield will be an important factor impacting 2015 ARC-CO payments. The same situation existed in 2014 and underscores the role that yield plays in determining revenue variability. Understanding ARC-CO payments is fundamentally different than understanding the price only payments of PLC.
- Variability of indicator payment for a crop between the low and high price projections needs to be underscored. Simply put, it is too early in the 2015 crop year to talk with much certainty about the size of payments. It is reasonable to say that 2015 crop year payments may occur, that they may be large if the right combination of price and yield materializes, that they will likely vary by crop, and that they will likely vary by program for a given crop.
This publication is also available at http://ohioagmanager.osu.edu.
Reminder: farmers and landowners, please take time to fill out the brief online survey to provide feedback about the farm program elections, the web-based decision tools and the election process at FSA. Your participation in this study is voluntary and completely confidential; any data collected will be averaged and reported in aggregate only. Individual information and responses will not be made public. To participate in the study, please click here or copy and paste http://go.illinois.edu/2014farmbillsurvey into your internet browser.
References
U.S. Department of Agriculture, World Agricultural Outlook Board. World Agricultural Supply and Demand Estimates, WASDE-546, October 9, 2015. http://usda.mannlib.cornell.edu/usda/waob/wasde//2010s/2015/wasde-10-09-2015.pdf
Disclaimer: We request all readers, electronic media and others follow our citation guidelines when re-posting articles from farmdoc daily. Guidelines are available here. The farmdoc daily website falls under University of Illinois copyright and intellectual property rights. For a detailed statement, please see the University of Illinois Copyright Information and Policies here.