


2016 Yield Distributions for U.S. Corn, Soybeans, and Wheat Using Historical WASDE May Forecast Errors
Introduction
Arguably the most watched early season forecast of U.S. crop yields is the May World Agricultural Supply and Demand Estimates (WASDE) by the U.S. Department of Agriculture (USDA). The May 10, 2016 WASDE contained forecasts for 2016 U.S. corn, soybean, and wheat yields of 168, 46.7, and 46.7 bushels per harvested acre, respectively. While these so-called point forecasts are important, the distribution of potential yields is just as important. As with point estimation, many methods exist to forecast yield distributions. This article takes a simple approach of using past May WASDE forecast errors. No claim is made that this forecast is superior only that it is easily constructed utilizing past performance of a widely followed, publicly available forecast.
Performance Assessment
WASDE began to consistently report May yield forecasts for the upcoming crop year with the 1993 crop (see data notes 1 and 2). The May WASDE yield forecast for a crop year is compared with the yield estimate published in the November WASDE after the crop year ends. For example, the May 2010 WASDE forecast is compared with the 2010 crop yield reported in the November 2011 WASDE. The one year removed November yield is used because USDA sometimes adjusts yield after the crop year ends to reflect information on carryout stocks and use during the crop year. End of year adjustments are most common for soybeans (see data note 3).
Historical Performance of May WASDE Forecasts – Corn
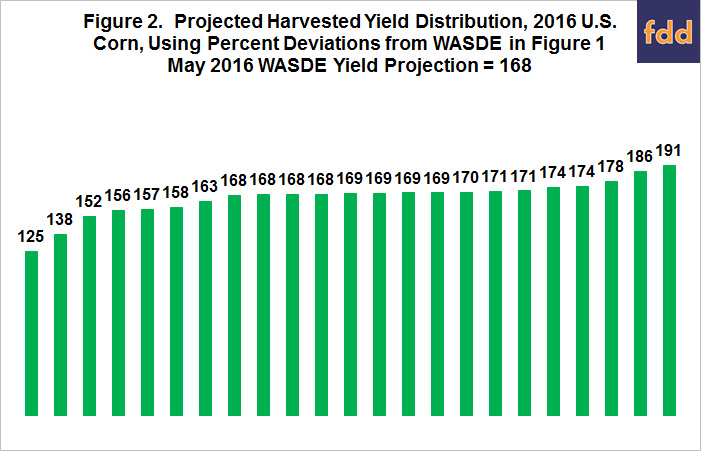
Relative to the May forecast, end-of-year yield for corn ranges from 14% higher for the exceptional weather year of 1994 to 26% lower for the drought year of 2012 (see Figure 1). End-of-year yield averages 1.4% lower than the May forecast, but the difference is not statistically significant. A key characteristic of the distribution of May WASDE forecast errors for corn is a smaller number of yield declines than yield increases (7 vs. 12 crop years) but a larger average magnitude of yield decline than yield increase (-11% vs. +4%).

Projected Yield Distribution – 2016 Corn
Applying the percent deviations in Figure 1 to the May 2016 corn yield forecast of 168 bushels per harvested acre results in a yield distribution that ranges from 125 to 191 bushels (see Figure 2). Almost half the distribution (48%) lies between 168 and 171 bushels. Yields less than 155 bushels and greater than 175 bushels each account for 13% of the distribution. The distribution in Figure 2 is generally consistent with the distribution that Irwin and Good report in their March 2, 2016 farmdoc daily article. Their distribution is based on a linear trend line yield between 1960 and 2015. For example, their implied low and high yields are 130 and 182 bushels. Their lower high yield reflects in part a lower mean expected yield (164 vs. 168 in this analysis) and the use of deviations measured in bushels instead of percent as used in this analysis.
Historical Performance of May WASDE Forecasts – Soybeans
Relative to the May forecast, end-of-year yield for soybeans ranges from 18% higher for the exceptional weather year of 1994 to 15% lower for the late growing season drought year of 2003 (see Figure 3). End-of-year yield averages only 0.4 % lower than the May forecast. They do not differ significantly. Negative and positive yield deviations are more balanced for soybeans (11 vs 10) than corn. Corn and soybean yield deviations are positively correlated, +0.58. While significant at 99% statistical confidence, the yield deviation of one crop only explains 33% of the other crop’s yield deviation (see data note 4). Thus, factors other than common growing season weather are important determinants of corn and soybean yield deviations.

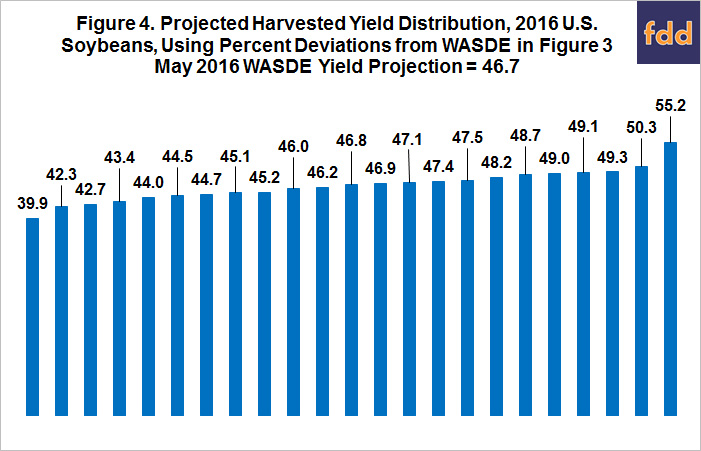
Projected Yield Distribution – 2016 Soybeans
Applying the percent deviations in Figure 3 to the May 2016 soybean yield forecast of 46.7 bushels per harvested acre results in a yield distribution that ranges from 39.3 to 55.2 bushels (see Figure 4). Almost half the distribution (48%) lies between 44.5 and 47.5 bushels. Thirty percent, 22%, and 9% of the distribution exceeds 48, 49, and 50 bushels, respectively. On the other hand, 13% is less than 43. This distribution is generally consistent with the distribution Irwin and Good report in their March 9, 2016 farmdoc daily article based on a linear trend line yield between 1960 and 2015. For example, their implied low and high yields are 38.4 and 50.4. As with corn, the lower high yield reflects in part a lower mean expected yield (45.0 vs. 46.7 in this analysis) and the use of deviations measured in bushels instead of percent as used in this analysis.
Historical Performance of May WASDE Forecasts – Wheat
Relative to the May forecast, end-of-year yield for wheat ranges from 11% higher for 1998 to 12% lower for 2002 (see Figure 5). End-of-year yield averages 2.0% higher than the May forecast as end-of-year yield is higher in 14 years. This difference is significant at the 90% level of statistical confidence. Thus, unlike corn and soybeans, the May forecast for U.S. wheat is biased; however, the degree of bias is just barely statistically significant at conventional standards. The correlation between yield deviations for corn and wheat is +0.30 and between soybeans and wheat is -0.18. Neither is significant at the conventional 90% confidence level. Thus, yield deviations for wheat are not statistically related to yield deviations for corn and soybeans.

Projected Yield Distribution – 2016 Wheat
Applying the percent deviations in Figure 5 to the May 2016 wheat yield forecast of 46.7 bushels per harvested acre results in a yield distribution that ranges from 41.1 to 51.9 bushels (see Figure 6). Almost half the distribution (48%) lies between 45 and 48.5 bushels. Thirty-five percent and 13% of the distribution exceed 49 and 50 bushels, respectively. Only 4% is less than 44. If the 2016 May forecast has the average bias that has existed since 1993, the end-of-year U.S. wheat yield is expected to be 47.6 bushels, or 0.9 bushels higher than the May 2016 forecast. In their March 30, 2016 farmdoc daily article, Irwin and Good examine U.S. yield for winter and spring wheat separately, but not the all wheat yield for the U.S.

Summary Observations
- Before summarizing the paper, it is important to underscore the usual disclaimer that the past is only a starting point that may not be a good predictor of the future.
- May WASDE yield forecast are found to be unbiased predictors of the end-of-year yield for corn and soybeans. For wheat, some evidence is found that the May yield somewhat underestimates the end-of-year yield.
- Percent deviations since 1993 in end-of-year WASDE yield vs. May WASDE forecast yield in combination with the May 2016 yield forecasts imply 2016 yield distributions that range from 125 to 191 bushels for corn, 39.3 to 55.2 bushels for soybeans, and 41.1 to 51.9 bushels for wheat.
- The percent deviations suggest end-of-year corn yield has a 13% chance of being less than 155 and a 13% chance of exceeding 175, end-of-year soybean yield has a 13% chance of being less than 43 and a 9% chance of exceeding 50, and end-of-year wheat yield has a 4% chance of being less than 44 and a 13% chance of exceeding 50.
- Corn is characterized by a smaller number of yield declines than yield increases after the May forecast but average magnitude of a yield decline exceeds that of a yield increase. Yield declines and yield increases after the May forecast are more symmetrical for soybeans than corn.
- In conclusion, the point estimate of expected yield in the May WASDE is important, but at this early stage of the growing season it is important not to get too anchored to the May point yield estimate.
References
Irwin, S., and D. Good. "Forming Expectations for 2016 U.S. Average Winter and Spring Wheat Yields: What About El Niño?" farmdoc daily (6):62, Department of Agricultural and Consumer Economics, University of Illinois at Urbana-Champaign, March 30, 2016.
Irwin, S., and D. Good. "Forming Expectations for 2016 U.S. Average Corn and Soybean Yields: What about El Niño Transitions?" farmdoc daily (6):51, Department of Agricultural and Consumer Economics, University of Illinois at Urbana-Champaign, March 16, 2016.
Irwin, S., and D. Good. "Forming Expectations for the 2016 U.S. Average Soybean Yield: What About El Niño?" farmdoc daily (6):46, Department of Agricultural and Consumer Economics, University of Illinois at Urbana-Champaign, March 9, 2016.
Irwin, S., and D. Good. "Forming Expectations for the 2016 U.S. Average Corn Yield: What About El Niño?" farmdoc daily (6):41, Department of Agricultural and Consumer Economics, University of Illinois at Urbana-Champaign, March 2, 2016.
Irwin, S., D. Good, and D. Sanders. "Understanding and Evaluating WAOB/USDA Soybean Yield Forecasts." farmdoc daily (5):84, Department of Agricultural and Consumer Economics, University of Illinois at Urbana-Champaign, May 7, 2015.
Irwin, S., D. Good, and D. Sanders. "Understanding and Evaluating WAOB/USDA Corn Yield Forecasts." farmdoc daily (5):79, Department of Agricultural and Consumer Economics, University of Illinois at Urbana-Champaign, April 30, 2015.
Westcott, P.C. and M. Jewison. "Weather Effects on Expected Corn and Soybean Yields." U.S. Department of Agriculture, Economic Research Service FDS-13g-01. July 2013.
U.S. Department of Agriculture, Office of the Chief Economist. World Agricultural Supply and Demand Estimates. Accessed May 2016. http://www.usda.gov/oce/commodity/wasde/index.htm.
Data Notes
- The author thanks Scott Irwin for providing his spreadsheet compilation of WASDE reports since the 1973 crop year for U.S. corn, soybeans, and wheat.
- An excellent overview and assessment of WASDE forecast procedures for corn and soybeans is presented by Irwin, Good, and Sanders in their farmdoc daily articles of April 30, 2015 and May 7, 2015. Although procedures have varied over time, a key component for all years was the use of some type of trend line yield calculation based on historical yields. Planting progress also was included in most years for corn. The asymmetric impact of weather on yields (poor yields are below trend more than good yields are above trend) was incorporated beginning in 2013. Wescott and Jewison describe this adjustment, which uses July and August temperature and precipitation. While number of observations is limited, Irwin, Good, and Sanders conclude forecast performance of the weather-adjusted model is consistent with earlier forecast performance. Nevertheless, any change in any forecast model warrants caution and should be kept in mind. Potential impact of ENSO (El Nino-Southern Oscillation) weather events are not included in WASDE forecasts. Irwin and Good discuss these events, known as El Nino and La Nina, in four farmdoc daily articles published during March 2016.
- Yields may be adjusted after the end of the crop year based on information in the next Census of Agriculture.
- For two variables, share of explanation, which ranges from 0% to 100%, is the square of the correlation coefficient, which ranges from -1.0 to +1.0. The author considers share of explanation to be a more accurate communication of the strength of the relationship between two variables.
Disclaimer: We request all readers, electronic media and others follow our citation guidelines when re-posting articles from farmdoc daily. Guidelines are available here. The farmdoc daily website falls under University of Illinois copyright and intellectual property rights. For a detailed statement, please see the University of Illinois Copyright Information and Policies here.