


Examining Trends in Liquidity for a Sample of Kansas Farms
Recent farmdoc daily articles have examined trends in working capital (farmdoc daily March 18, 2016 and June 17, 2016) and provided projections for 2016 (farmdoc daily June 21, 2016). These two articles focused on median or average working capital. Though it is important to understand trends in average liquidity measures, it is also important to examine differences in liquidity among farms. In particular, most analysts want to know how many farms fall below specific liquidity thresholds. This article examines differences in liquidity for Kansas Farm Management Association (KFMA) farms with continuous data from 1996 to 2015. Farm types represented in this sample of farms include crop farms, crop/beef farms, and beef farms.
Commonly used liquidity measures include the current ratio, working capital to gross revenue, and working capital per acre. The second measure can also be computed using gross farm income, value of farm production, or total expenses. This article uses the current ratio and working capital to value of farm production to measure liquidity. Value of farm production is considered a more appropriate measure of gross income when the sample of farms includes both crop and livestock farms.
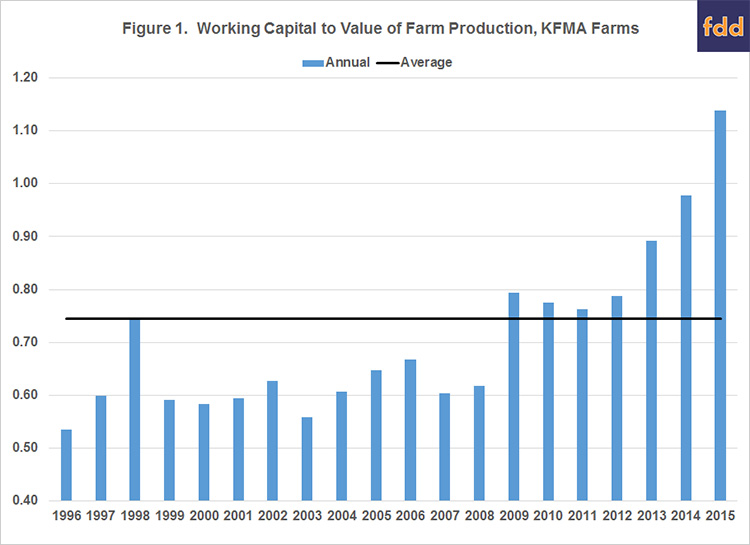
Figure 1 illustrate the annual averages for working capital to value of farm production for the sample of KFMA farms. Working capital to value of farm production averaged 0.744 over the 20-year period. This liquidity measure was above the average from 2009 to 2015. The 2015 value is interesting. Despite a large drop in net farm income (dropped from $111,324 in 2014 to $11,149 in 2015), working capital to value of farm production continued to increase in 2015. This increase can be explained by looking at the components of the ratio. Average working capital declined by approximately $27,000. In contrast, average value of farm production dropped by $102,000. Combining these two numbers resulted in a higher average liquidity measure. It is important to print out that the drop in working capital in 2015 was the first decline in this variable since 2002.
Trends in the average current ratio for the sample of KFMA farms are depicted in Figure 2. The average current ratio during the 20-year period was 3.55. The current ratio was above the average ratio from 2008 to 2015. The current ratio peaked in 2012 at 5.40, and dropped to 4.08 in 2015. Though relatively lower in 2015 compared to its peak value, the current ratio in 2015 was still higher than the averages experienced prior to 2009.

As noted in the introduction, most analysts are interested in how liquidity measures vary among farms. To examine liquidity differences, we identified the percentage of farms below two thresholds for working capital to value of farm production. The two thresholds examined were 0.20 and 0.35. The second threshold is a commonly used threshold by financial analysts and would be considered an adequate level of working capital to weather a one or two year downturn. The first threshold (i.e., 0.20), on the other hand, depicts a situation where a farm may have trouble repaying loans. Figure 3 illustrates the trends in these two thresholds over the 20-year period. On average, over the 20-year period, the percentage of farms with a working capital to value of farm production below 0.20 and 0.35 were 17.1% and 26.8%, respectively. The current percentages are 11.3% for the 0.20 threshold and 17.0% for the 0.35 threshold. The percentage of farms below the 0.20 threshold went up substantially in 2015. However, the current percentage of farms below this threshold is still smaller than what it was prior to 2009.

This article examined trends in liquidity for a sample of KFMA farms. Despite a large drop in net farm income in 2015, most farms in the sample still have solid liquidity positions. Having said that, the percentage of farms below critical liquidity thresholds increased substantially in 2015. These farms may find it difficult to repay loans later this year.
Liquidity measures in 2016 depend on a multitude of factors including crop prices and yields, weather, and other factors, all of which are inter-related. Using current futures prices adjusted for basis and trend yields; we expect working capital, working capital to value of farm production, the current ratio, and the percentage of farms below critical liquidity thresholds to increase. Thus, managing working capital is very important in the current environment.
References
Krapf, B., D. Raab, and B. Zwilling. "How Does the Percentage of Cash Rented Acres Affect Liquidity?" farmdoc daily (6):115, Department of Agricultural and Consumer Economics, University of Illinois at Urbana-Champaign, June 17, 2016.
Schnitkey, G. "Working Capital Changes Projected for Grain Farms in 2016: Before and After Recent Price Changes." farmdoc daily (6):117, Department of Agricultural and Consumer Economics, University of Illinois at Urbana-Champaign, June 21, 2016.
Zwilling, B., B. Krapf, and D. Raab. "Working Capital and the Age of the Farm Operator." farmdoc daily (6):54, Department of Agricultural and Consumer Economics, University of Illinois at Urbana-Champaign, March 18, 2016.
Disclaimer: We request all readers, electronic media and others follow our citation guidelines when re-posting articles from farmdoc daily. Guidelines are available here. The farmdoc daily website falls under University of Illinois copyright and intellectual property rights. For a detailed statement, please see the University of Illinois Copyright Information and Policies here.