


Assessing Brazilian Corn Yield Risks with the First and Second Crops: Historical Deviations from Trend
We recently began a series of articles to evaluate the history of corn and soybean yields and deviations from trend yield in Brazil and Argentina. The objective of the yield analysis is to provide a basis for forming expectations about the likely yields of the 2017 crops. Previous articles focused on the alternative sources of historical yield estimates, the selection of the appropriate series to use in the analysis for both corn and soybeans, and the selection of the best-fitting trend model for each commodity and country (farmdoc daily, November 2, 2016; November 9, 2016; November 16, 2016). The focus of this article is on first and second crop corn yield trend estimates and trend deviations in Brazil. Brazil is now the third largest corn producer in the world and recently, rose to be the second largest corn exporter. Because most of the recent growth has been associated with second crop corn, it is important to examine trend estimates and trend deviations separately for the first and second corn crops in Brazil.
Background
In our previous articles on corn and soybean yields in Argentina and Brazil we selected the yield estimates provided by the USDA’s Foreign Agricultural Service (FAS) as the most appropriate estimates. However, separate data on first and second crop corn yields in Brazil are not available from FAS. The National Food and Supply Company (CONAB), a public company allied with the Ministry of Agriculture, Livestock, and Supply in Brazil, does make estimates for both crops. Before using the CONAB data on first and second crop yields it is useful to compare FAS and CONAB data on national average corn yields in order to shed light on measurement errors that may be present in the CONAB data. Figure 1 provides a comparison of FAS yield estimates for Brazil relative to CONAB yield estimates. In both cases, Brazilian corn yield estimates are weighted averages of the first and second crops by using production and planted acreage for each crop during the year to calculate corn yield. Note that the yield estimation methodology used by CONAB is very different than used by NASS to make yield estimates for the U.S. Specifically, CONAB yields are based on past trends, expert opinion, and industry intelligence, while NASS yields are based on random samples of farm operators and field measurements. The different data sets show some deviations from one another in the 1990’s and the first decade of the 2000’s, but overall there is very little difference in the two series. This suggests we can proceed with analysis of the separate CONAB series on first and second crop yields with reasonable confidence in the accuracy of the data. Finally, note that, as previously discussed in the farmdoc daily article of November 9, 2016, we estimated the trend for Brazil for two time periods–1961 through 1988 and 1989 through 2016–in order to reflect what appears to be a trend change in the late 1980s. The trend change may be associated with the timing of the rapid expansion of second crop corn area.

Figure 2 presents acreage data that reflects the changing nature of Brazilian corn planting over the 1989 – 2016 period. Total harvested acreage of corn in Brazil has only increased marginally but the composition has changed tremendously. Specifically, second crop corn acreage grew rapidly over the period and surpassed first crop corn acreage in 2012. Second crop corn planted acres accounted for approximately 65% of total corn acres in Brazil in 2016. The second crop, known as Safrinha, is normally planted between January and March and harvested between June and August. A large portion of the crop is grown in the Central-West region of Brazil and is susceptible to the monsoonal dry season in these regions of Brazil. The first crop of corn in Brazil is grown in the traditional and more temperate corn regions of the South and Southeast. This crop is planted in September and harvested in March. As can be seen in Figure 1, this crop is declining, and the traditional corn regions are moving to second crop corn over time.

Double-cropping is extensive in Brazil with soybeans-corn and soybeans-cotton being major cropping strategies in many regions. The predominance of double-cropping has led to the growth in second crop corn production. The rise of the second crop production strategy is also directly linked to the increase in Brazilian corn exports. Most of the first crop is used domestically while the second crop is exported to a greater extent. The harvest of second crop corn occurs after Brazil’s major soybean export period and allows for more efficient movement of corn out of the country.
Historical Corn Yields and Deviation Patterns
This analysis examines trends and trend deviations for Brazilian corn yields during the 1989-2016 period. We use average corn yield estimates, not adjusted for varying weather conditions from year to year, for the period 1989 through 2016 to determine the form of the trend that best fits those yield estimates and to calculate the trend yield for 2017. It should be noted that using yields that are not adjusted for varying weather conditions actually results in a slight under-estimate of trend yield due to the asymmetric effect of weather on actual yields (Swanson and Nyankori, 1979; Tannura, Irwin, and Good, 2008). That is, poor weather reduces yields more than good weather improves yields so that the impact of technology (trend) is under-estimated due to sharp reductions in yield from poor weather years. Our previous research on U.S crop weather models that adjust for the asymmetric effect of weather on crop yields indicates the downward bias is about one-tenth of a bushel for the trend coefficients (Irwin, Good, and Tannura, 2009).
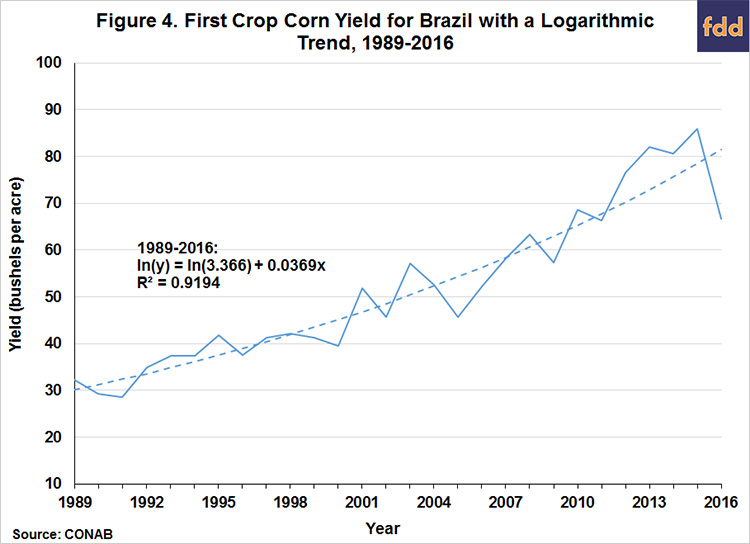
Figure 3 shows the national average corn yields in Brazil for the period 1989 through 2016 using CONAB data. We fit a logarithmic trend to the yield data. A logarithmic trend implies that yields have increased at a constant percentage rate rather than a constant bushel rate over time. For Brazil, the logarithmic trend estimates an average 3.7 percent annual increase in yields from 1989 through 2016. The fit of the trend is quite high, with an R2 of 0.92, so that trend explains 92 percent of the annual yield variation over the 28-year period. Since Brazilian corn yields reflect the weighted average of first and second crop corn harvests, we analyze yield trends and deviations for each crop separately. Figures 4 and 5 provide annual corn yields for first and second Brazilian corn crop, respectively, again using CONAB data. The best fit is the logarithmic trend for both crops during the period. For first crop corn, the logarithmic trend estimates an average 3.7 percent annual increase in yields from 1989 through 2016, the same as the national average yield. For second crop corn, the logarithmic trend estimates an average 5.8 percent annual increase in yields from 1989 through 2016, substantially higher than the first crop. In essence, first crop corn yields were about 50 percent larger than second crop yields in the early 1990s but the two are now about the same level. This catching up process required a very high percentage increase in trend yields from year-to-year. A major question going forward is whether the rate of second crop trend yield increase is sustainable. Finally, deviations both below and above the trend in both crops suggest the potential for major deviations in yield over the time period. In particular, the average yield in 2016 for both crops came in substantially below trend due to drought conditions.


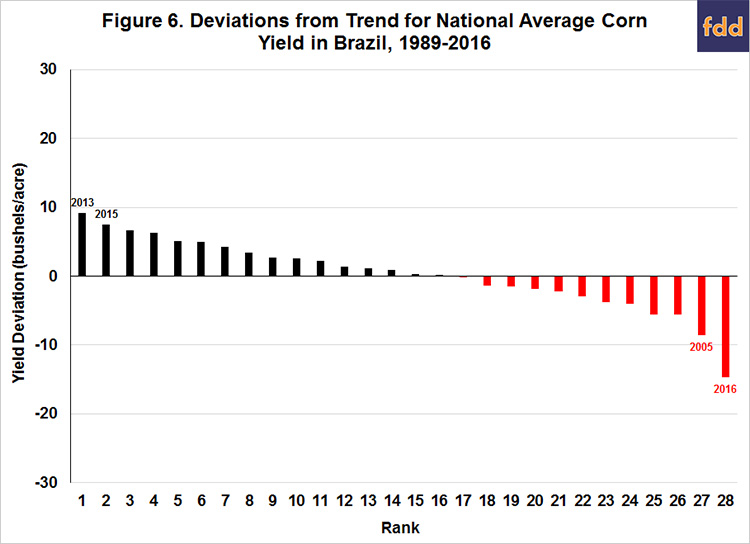
Historical deviations for national average Brazilian corn yields for the period 1989-2016 are shown in Figure 6. Building on a previous analysis of international grain yields in this farmdoc daily article by Carl Zulauf (November 11, 2015), we investigate the yield variability occurrences in Brazilian corn production in more detail. Over the 28-year period, the average Brazilian corn yield was above trend in 16 years and below for 12 years, or about 57 percent of the time above trend and 43 percent below. The average positive deviation was 3.67 bushels while the average negative deviation was -4.37 bushels. Mirroring U.S. yields, positive deviations above trend are more frequent but smaller compared to negative deviations. The largest deviation below trend was 15 bushels per acre in 2016. Two of the largest deviations above trend were approximately 9 and 7 bushels in 2013 and 2015, respectively. It is clear that yields have been highly variable in recent years, with what appeared to be a sharply increasing yield trend until the 2016 drought.
The first crop corn yield deviations (Figure 7) possess a striking similarity to the total Brazilian crop. The largest deviations are in similar years with closely aligned magnitudes of deviation. The first crop corn yields came in above its logarithmic trend in 16 of the 28 years and possessed the nearly the same average positive deviation and negative deviation from trend as the national average yield. Second crop corn yield deviations (Figure 8) tell a different story, despite the fact that the frequency of positive and negative deviations is the same as for the national average yield (57 and 43 percent, respectively). In particular, the magnitudes of deviations were much larger in second crop yields. The average positive deviation was 5.54 bushels while the average negative deviation was -7.19 bushels. In 2016, the negative deviation was an astounding 27 bushels per acre and more than 14 bushels larger than the second largest negative deviation. The largest positive deviations for second crop corn occurred in 2003 and 2012.


Clearly, the second crop corn yield is substantially more variable than the first crop corn yield relative to trend. This is related to the regions where the second crop is grown and the different weather patterns for second crop production. In particular, the monsoonal sub-tropical climate where much of the second crop is grown has distinct wet and dry seasons. If the dry season starts earlier than normal there is little chance for recovery in production prospects. There is also increased risk to second crop yields in the traditional southern growing regions simply due to trying to squeeze two crops into one growing season. The resulting higher variability of second crop corn yields has direct implications for the riskiness of total Brazilian corn production since the second crop has grown to approximately 60 percent of the total corn crop over the last five years. Specifically, it is no longer appropriate to project the riskiness of national average corn yield in Brazil based on the history of national average yields due to the changing composition of first and second crops. The only recourse is to separately estimate the risks for first and second crops and then take a weighted average of these risks to reflect the current dominance of the second crop.
Implications
An examination of the average first and second crop corn yields in Brazil for the period 1989 through 2016 reveals an upward yield trend in both crops, with substantial annual variation. The yields have not increased by a constant bushel value per year, but have increased by a constant percentage value. The estimated logarithmic corn yield trend for Brazil in 2017 is 84.8 bushels per acre, 18.05 bushels above the 2016 average, but 1.23 bushels below the record yield of 2015. The first crop corn yield trend is estimated at 84.5 bushels and second crop yield trend is estimated at 94 bushels. Based on the projections of harvested acreage in the USDA’s November 9 World Agricultural Production report, the trend yield for Brazil points to a 2017 crop of 3.438 billion bushels, 800 million bushels (30 percent) larger than the 2016 crop.
The deviation in yields calculations illustrates the large variability in yields possible with the second crop. For example, the second crop corn yield in 2016 was an astounding 27 bushels below trend. Given the recent dominance of second crop corn production, this means that it is no longer appropriate to project the riskiness of national average corn yield in Brazil based on the history of national average yields. In a future article we will analyze the historical deviations from trend yield in corn for Brazil and Argentina and evaluate conditional yields for each country under La Nina climate events in order to form yield expectations for 2017.
References
Good, D., T. Hubbs, and S. Irwin. "Assessing South American Corn Yield Risks-Estimating the Yield Trend." farmdoc daily (6):212, Department of Agricultural and Consumer Economics, University of Illinois at Urbana-Champaign, November 9, 2016.
Good, D., T. Hubbs, and S. Irwin. "Assessing South American Corn and Soybean Yield Risks: Exploring the Data Sources." farmdoc daily (6):207, Department of Agricultural and Consumer Economics, University of Illinois at Urbana-Champaign, November 2, 2016.
Irwin, S., and D. Good. "Forming Expectations for the 2016 U.S. Average Corn Yield: What About El Niño?" farmdoc daily (6):41, Department of Agricultural and Consumer Economics, University of Illinois at Urbana-Champaign, March 2, 2016.
Irwin, S., D. Good, and M. Tannura. "Early Prospects for 2009 Corn Yields in Illinois, Indiana, and Iowa." Marketing and Outlook Brief 2009-01, Department of Agricultural and Consumer Economics, University of Illinois at Urbana-Champaign, June 2009.
Swanson, E.R., and J.C. Nyankori. "Influence of Weather and Technology on Corn and Soybean Yield Trends." Agricultural Meteorology 20(1979):327-342.
Tannura, M., S. Irwin, and D. Good. "Are Corn Trend Yields Increasing at a Faster Rate?" Marketing and Outlook Brief 2008-02, Department of Agricultural and Consumer Economics, University of Illinois at Urbana-Champaign, February 2008.
Zulauf, C. "Variability in Corn, Soybean, and Wheat Production across the Globe." farmdoc daily (5):210, Department of Agricultural and Consumer Economics, University of Illinois at Urbana-Champaign, November 11, 2015.
Disclaimer: We request all readers, electronic media and others follow our citation guidelines when re-posting articles from farmdoc daily. Guidelines are available here. The farmdoc daily website falls under University of Illinois copyright and intellectual property rights. For a detailed statement, please see the University of Illinois Copyright Information and Policies here.