


Historical Look at SCO (Supplemental Coverage Option) Participation
Supplemental Coverage Option (SCO) insurance is generating considerable discussion. This article reviews historical participation in SCO using data from USDA, RMA’s (US Department of Agriculture, Risk Management Agency) Summary of Business website. Objective is to provide perspectives on historical interest and farm decisions concerning SCO for those considering SCO for 2020 crops.
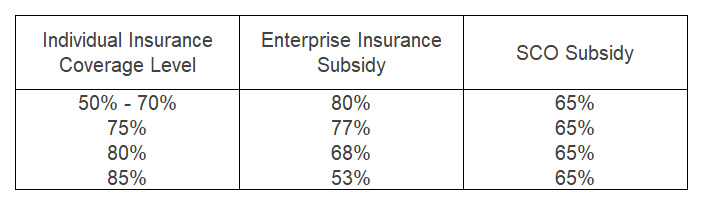
Background: SCO was first made available for the 2015 crop after being authorized in the 2014 farm bill. SCO is an area insurance product designed to cover part of the deductible of an individual farm insurance product. Individual farm insurance must be purchased for SCO to be an option. SCO’s coverage window is between 86% and the underlying individual farm insurance coverage level. For example, SCO’s coverage window is 75% to 86% if 75% individual insurance is bought. SCO is not an option if the farm elects the ARC (Agricultural Risk Coverage) commodity program, although an exception was granted for 2019 crops due to late passage of the 2018 farm bill and thus a late commodity program sign-up period. SCO’s subsidy rate is 65%. Subsidy rates for SCO and enterprise insurance are compared in Data Note 1. For additional, recent discussions of SCO, see the February 12, 2019, March 12, 2019, and December 17, 2019 farmdoc daily articles by Schnitkey.
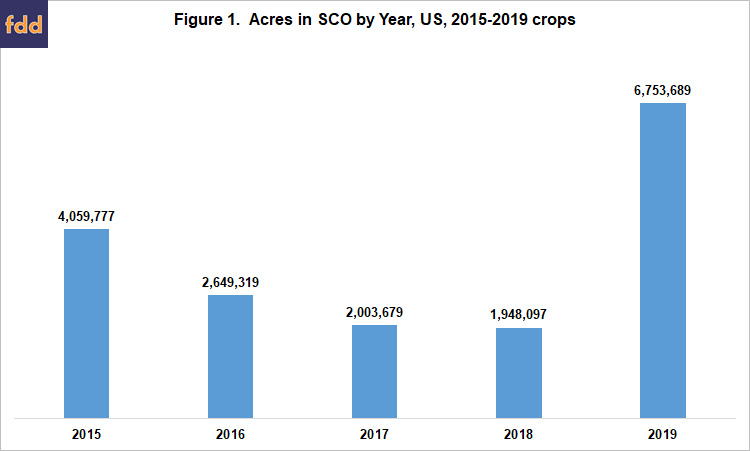
Acres: Acres in SCO increased by 4.8 million in 2019. Reasons for the increase include the previously mentioned exception granted for 2019 and the expected shift from the ARC to PLC (Price Loss Coverage) commodity program under the 2018 farm bill. Prior to 2019, acres in SCO had declined each year since 2015 (see Figure 1). The decline in total from 2015 through 2018 exceeded 50%.
Crops: The increase in 2019 acres was accompanied by a notable shift in the distribution of SCO acres, especially from wheat to corn and soybeans (see Figure 2). This shift reflects the factors noted in the previous paragraph, especially given that over 90% of corn and soybean base acres were in ARC-CO during the 2014 farm bill period. In addition, this shift likely also reflects the on-going decline in acres planted to wheat and increase in acres planted to corn and soybeans.
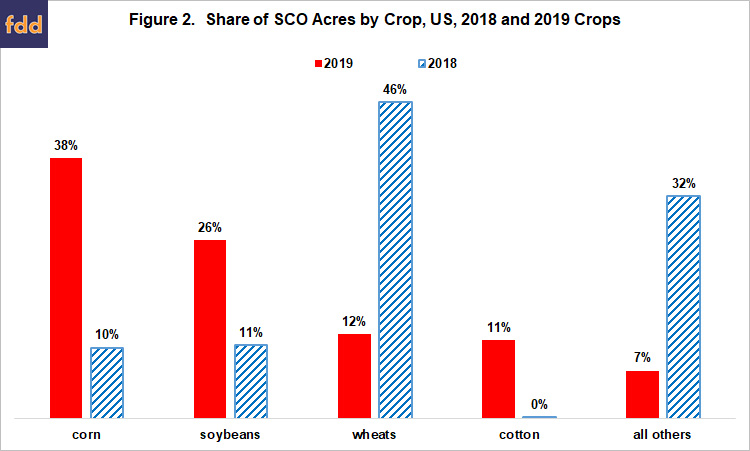
Cotton’s share also increased notably. Cotton had its own version of SCO in the 2014 farm bill, known as STAX (Stacked Income Protection Plan). STAX is being phased out as part of the compromise that led to the addition of seed cotton as a program commodity for ARC-CO and PLC. Zulauf and Orden (December 2014) contains a detailed comparison of SCO and STAX.
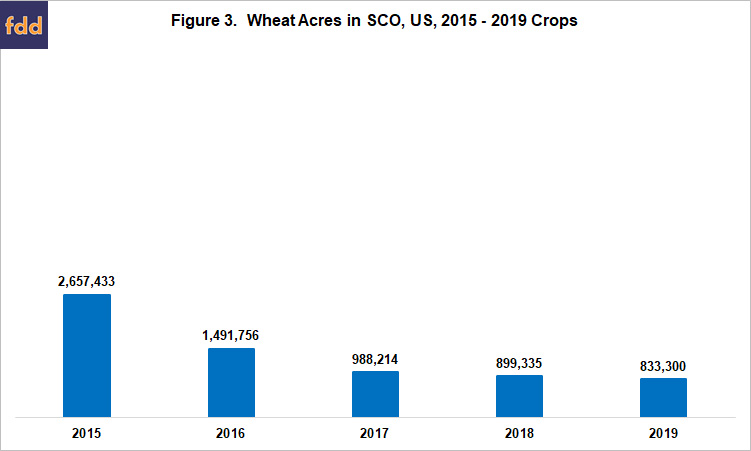
Wheat Acres: Unlike corn and soybeans, wheat acres in SCO declined in 2019, continuing a trend since 2015. Perhaps more importantly, acres in SCO were lower in 2018 than 2015 for all crops for which SCO was first offered in 2015, including corn, soybeans and cotton.
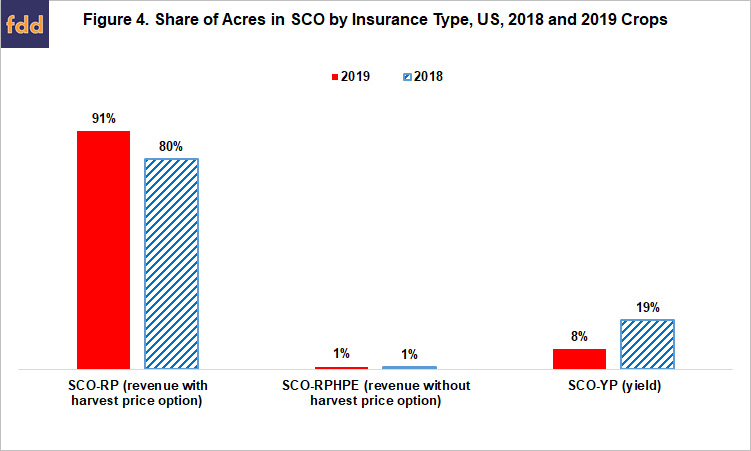
Insurance Product Type: SCO is revenue (yield) insurance if the underlying individual farm insurance is revenue (yield) insurance. The SCO products are thus SCO-RP, revenue insurance with HPO (Harvest Price Option); SCO-RPHPE, revenue insurance without HPO, and SCO-YP, yield insurance. SCO-RP dominated in all years. Its share ranged from 80% in 2018 to 91% in 2019 (see Figure 4).
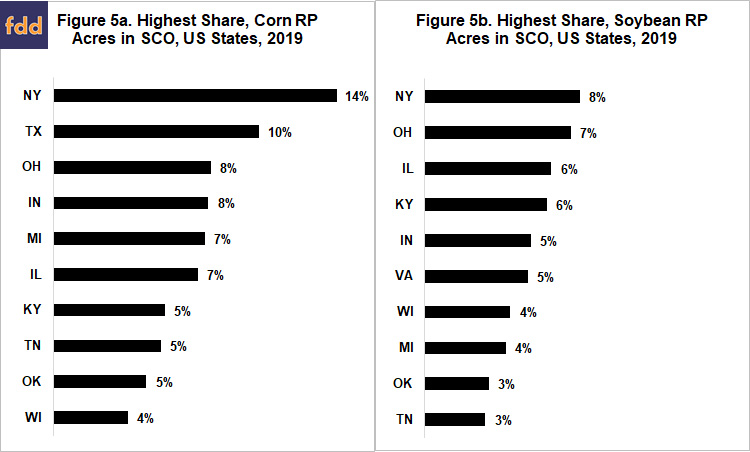
Geography: New York had the highest share of RP acres in SCO-RP for both corn and soybeans among states with 100,000 or more RP acres of the crop in 2019 (see Figure 5). More broadly, 9 of the top 10 states overlap for corn and soybeans. The exceptions are Texas (corn) and Virginia (soybeans). The 10 states are located east of the Mississippi River and in the southern plains.
Coverage Level: The most common coverage level for the underlying individual farm RP insurance in 2019 was 80% for corn and soybeans, 75% for wheat, and 70% for cotton (see Figure 6). Approximately 85% of SCO acres for each crop are with individual farm RP insurance that had coverage levels of 70% to 80%. Other individual farm coverage levels of note are 50% for cotton, 65% for wheat, and 85% for corn and soybeans. The latter accounted for 13% of corn and 12% of soybean SCO acres.
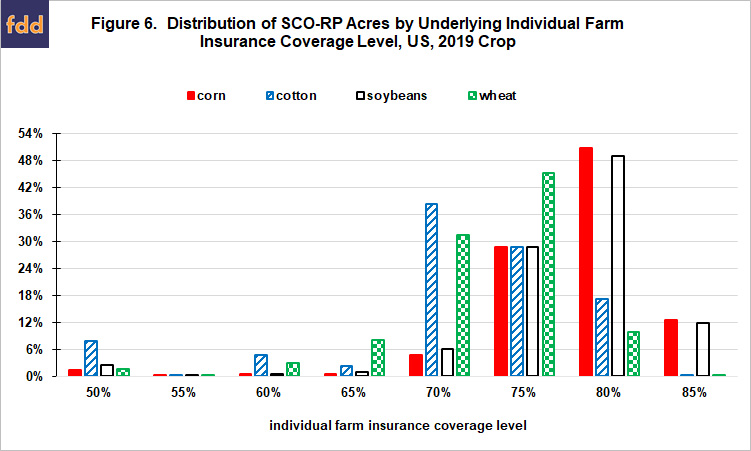
The most popular individual farm insurance coverage in 2019 with SCO compared to individual farm coverage without SCO was 75% for wheat and 80% for corn, cotton, and soybeans. The 80% coverage level was especially popular for corn and soybean SCO acres relative to corn and soybean acres without SCO.
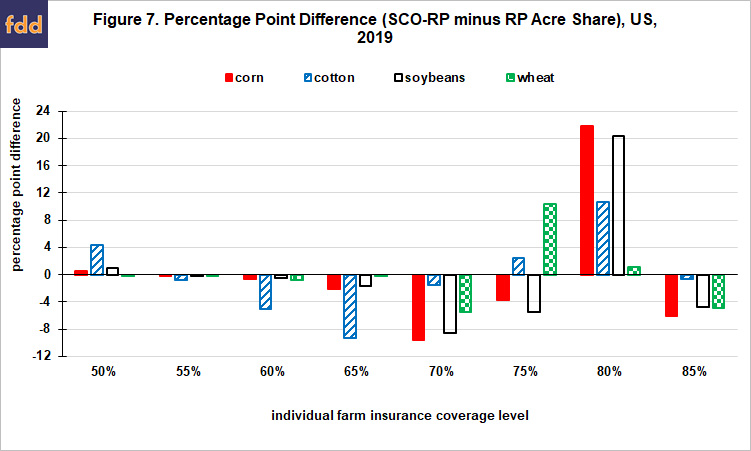
Figure 7 suggests corn, soybeans, and wheat had the largest substitution of SCO area coverage for 85% individual farm coverage. Other than this observation, more detailed data are needed to differentiate between using SCO to “buy down” individual coverage and using SCO to “top off” individual farm coverage by adding SCO to existing individual farm coverage. “Topping off” is expected to be most common in areas with 75% as the highest available individual farm coverage level. Interestingly, Figure 7 does not rule out the possibility that some farms bought both higher individual farm insurance coverage levels and SCO insurance in 2019.
Summary Observations
The SCO insurance option is generating considerable interest. Based on USDA, RMA Summary of Business data, interest in SCO in 2019 was especially notable for corn, soybeans, and cotton and areas located east of the Mississippi River and in the southern plains.
Given the interest in SCO, it is important to consider the decline in SCO acres between 2015 and 2018. Although most pronounced for wheat, the decline occurred for all crops for which SCO was first offered in 2015. The declines prompt the following important questions:
- (1) “Did farms that tried SCO in 2015 find it was not cost effective risk protection even with cost savings from lower insurance premiums?” In short, “Did farmers not like what they paid for?”
- (2) “In particular, did the so-called basis risk that results from different changes in revenue at the area and individual farm level more than offset the cost advantages of SCO?”
- (3) “Will farms that bought SCO in 2019 in areas with sizable prevent plant acres return to higher individual farm insurance to have more risk protection for prevent plant?” Area insurance, including SCO, does not cover prevented plantings.
- (4) As an overarching, summary question: “Will the same storyline emerge for corn and soybean SCO acres over the 2018 farm bill period that emerged for wheat acres over the 2014 farm bill period?”
Should the same storyline emerge, Congress and farm policy actors will have to decide if they wish to invest further in the SCO policy experiment, with a likely option being changes to the relationship between the subsidy levels for individual farm insurance and SCO.
Data Note
References and Data Sources
The National Agricultural Law Center. (2019) United States Farm Bills. http://nationalaglawcenter.org/farmbills/ (contains legislative text of all farm bills)
Schnitkey, G. “Decisions Concerning the 2018 Farm Bill and SCO.” farmdoc daily (9):234, Department of Agricultural and Consumer Economics, University of Illinois at Urbana-Champaign, December 17, 2019.
Schnitkey, G. “Supplemental Coverage Option (SCO) for 2019.” farmdoc daily (9):43, Department of Agricultural and Consumer Economics, University of Illinois at Urbana-Champaign, March 12, 2019.
Schnitkey, G. “Supplemental Coverage Option: An Insurance Option Available to More Farmers.” farmdoc daily (9):25, Department of Agricultural and Consumer Economics, University of Illinois at Urbana-Champaign, February 12, 2019.
US Department of Agriculture, Risk Management Agency. January 2020. Summary of Business. https://www.rma.usda.gov/SummaryOfBusiness
Zulauf, C. and D. Orden. December 2014. The U.S. Agricultural Act of 2014: Overview and Analysis. International Food Policy Research Institute (IFPRI) Discussion Paper 01393. http://ebrary.ifpri.org/cdm/singleitem/collection/p15738coll2/id/128802/rec/1
Disclaimer: We request all readers, electronic media and others follow our citation guidelines when re-posting articles from farmdoc daily. Guidelines are available here. The farmdoc daily website falls under University of Illinois copyright and intellectual property rights. For a detailed statement, please see the University of Illinois Copyright Information and Policies here.