


Feeder Cattle Production – Are there differences based on the weight purchased?
To help answer the question regarding the differences based on the weight purchased in feeder cattle production, we will look at feeder cattle operations enrolled in Illinois Farm Business Farm Management (FBFM) over a twenty-year period (2001 to 2020). As with all livestock operations in Illinois, the number of useable FBFM feeder cattle operations have gradually been coming down, going from a high of 165 farms in 2001 to 61 farms in 2020. In this study, the feeder cattle operations are separated into three categories based on the average purchase weight of the feeder cattle. Those groups are less than 500 pounds (<500), 500 pounds to 750 pounds (500-750) and 750 pounds and greater (750+). On average, the majority of FBFM feeder cattle operations purchase their feeder cattle between 500 pounds and 750 pounds.

Weights & Prices
Table 1 shows the twenty-year average on weight and prices for each of the three groups. The priced paid per hundredweight (cwt) is the highest for the <500 and 500-750 groups while the 750+ group paid almost $6 less per hundredweight. When looking at the average weight per market cattle sold, we see that the smaller the animal was when purchased the smaller the animal was when sold. For example, the <500 group had the lowest average weight purchased of 305 pounds as well as the lowest average weight sold of 1,193 pounds. On average, the <500 group market their cattle around 1,200 pounds while the 500-750 and 750+ groups market their cattle around 1,300 pounds and 1,400 pounds, respectively. These average sale weights are true for the last ten-year and five-year averages as well. When these feeder cattle operations market their cattle, the 500-750 group and 750+ group receive the highest average price received on a hundredweight basis. The <500 group sells their cattle on average about $6 less per hundredweight when looking at the twenty-year average. When you combine these items, even though the <500 group received less dollars per hundredweight when they sold cattle, that group had the highest gross returns due to lower purchase weights.
Feed Costs
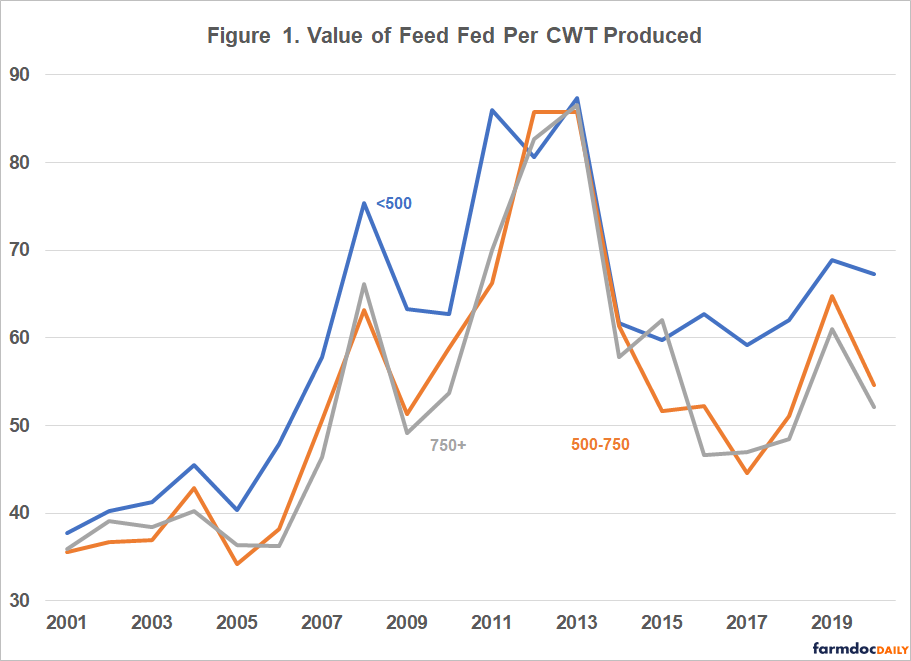
In Figure 1, the average value of feed fed per hundredweight produced for each group is shown from 2001 to 2020. The value of feed fed not only includes the cost of fed purchased, but also a value for farm raised or produced grain, silage, hay, pasture and other roughages used in the operation. In the majority of the years, the <500 group had the highest value of feed fed per hundredweight produced, while the other two groups were lower, but similar to each other. When grain prices were at their highest in 2012 and 2013, all three groups had about the same cost for feed per hundredweight produced. Also, when looking prior to when the ethanol mandate was put into place, the three groups where much closer together.
Pounds of Feed Fed
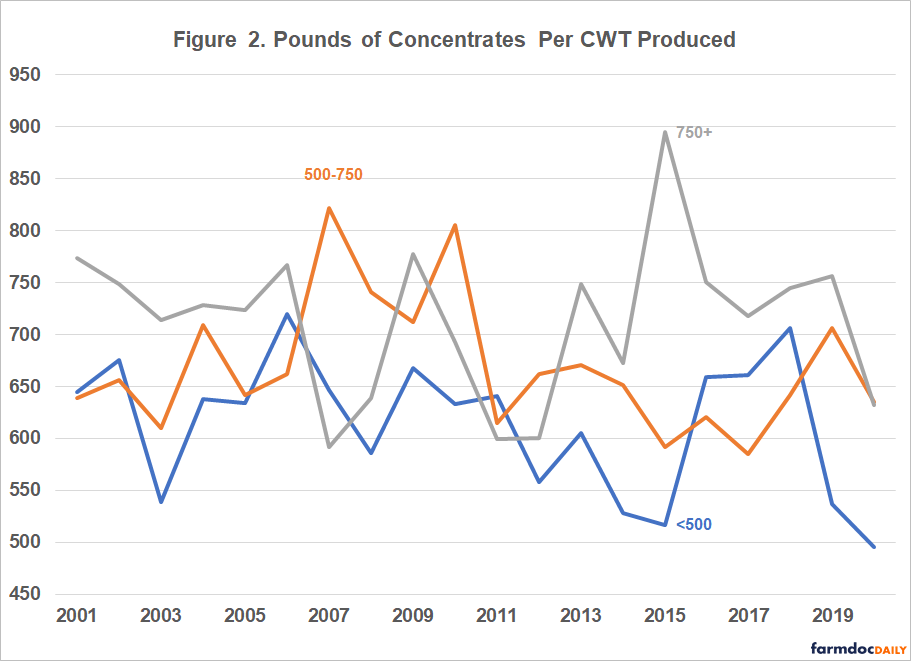
Figures 2 and 3 show the pounds of different feedstuffs fed per hundredweight of gain. Concentrates in Figure 2 would include grains and supplements. The <500 group typically fed less pounds of concentrates per hundredweight of gain, while the 750+ group was normally the highest in the last twenty years. In 2011, when concentrates would have been at higher levels, all three groups saw a decrease from prior years. Some of the year over year differences are due to the cost of other feedstuffs such as silage or hay and roughages.
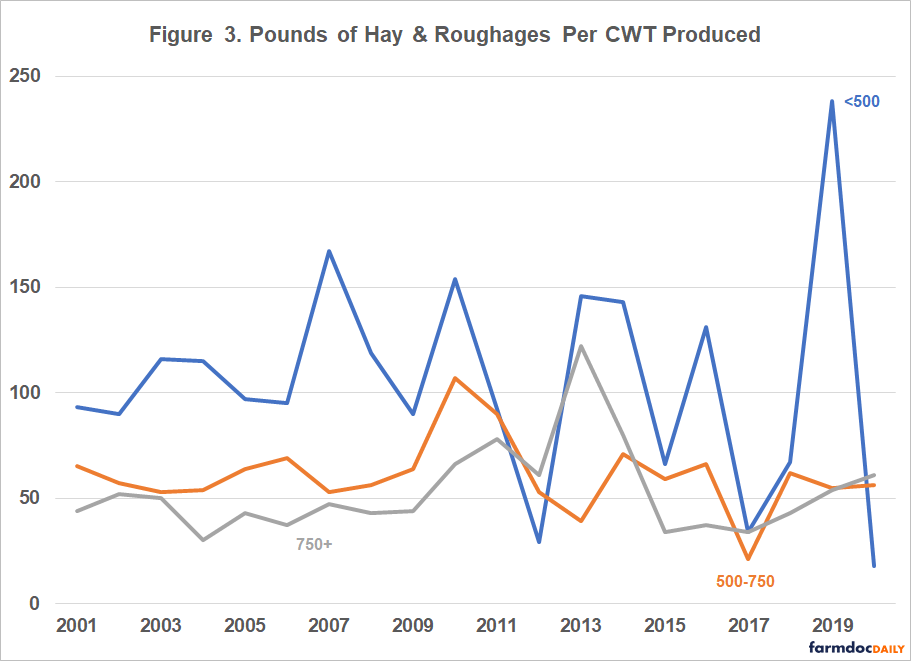
With the pound of hay and roughages fed per hundredweight produced in Figure 3, we see the opposite to Figure 2. The <500 group fed much more pounds per hundredweight produced than the other two groups, while the 750+ group typically fed the least. However, it is interesting to note that in 2012 when concentrates were at their highest levels, all three groups also saw a decrease in the use of hay and roughages. One reason we see the <500 group use less concentrates, but more hay and roughages is due to backgrounding. Backgrounding is done with lighter weight cattle and includes grazing and feeding more hay and roughages until they put on more weight. Another reason is when cattle get heavier, they require more of a finishing ration. A finishing ration has a much higher protein content which will primarily come from concentrates. This finishing ration is needed for heavier weight cattle to help reach the desired carcass grade that can bring a higher average price when selling cattle at market.

Returns Above Feed Costs
Figure 4 shows returns above feed costs per hundredweight produced. Returns include the sale price minus the cost to purchase it as well as the change in inventory value of any cattle still in inventory at calendar year-end. All three groups in this graph tend to follow each other closely except from 2013 to 2015 where the <500 group separated itself from the other two groups. When you look at the twenty-year average of these three groups in the graph, it explains why from the highest to the lowest, the groups are only separated by about $1.30 per hundredweight produced. The highest twenty-year average was for the 500-750 group.
Conclusion
As we look at different factors involved in production of feeder cattle (outside of costs to produce but including feed and purchase cost of cattle), we see many differences in average sale weights, average sale prices, value of feed fed and pounds of feed fed. However, when these items are combined to calculate returns above feed costs per hundredweight produced, the difference in the three different groups is small. It is ironic that the 500-750 group that has the majority among FBFM feeder cattle operations, also has the highest returns above feed cost per hundredweight produced by almost a dollar. Therefore, keeping good, accurate records and comparing them over-time is useful to help make the best financial decision for your feeder cattle or any operation.
The author would like to acknowledge that data used in this study comes from farms across the State of Illinois enrolled in Illinois Farm Business Farm Management (FBFM) Association. Without their cooperation, information as comprehensive and accurate as this would not be available for educational purposes. FBFM, which consists of 5,000 plus farmers and 68 professional field staff, is a not-for-profit organization available to all farm operators in Illinois. FBFM field staff provide on-farm counsel with computerized recordkeeping, farm financial management, business entity planning and income tax management. For more information, please contact the State Headquarters located at the University of Illinois Department of Agricultural and Consumer Economics at 217-333-8346 or visit the FBFM website at www.fbfm.org.
Disclaimer: We request all readers, electronic media and others follow our citation guidelines when re-posting articles from farmdoc daily. Guidelines are available here. The farmdoc daily website falls under University of Illinois copyright and intellectual property rights. For a detailed statement, please see the University of Illinois Copyright Information and Policies here.