


Third Consecutive La Niña? What to Expect from Soybean Yields in the United States, Brazil and Argentina
International long-term forecast models hint at the possibility of a third consecutive La Niña event this year. It is not uncommon to see La Niña occurring over two successive seasons. This happened in both 2021-2022 and 2011-2012. However, it is rare to see three consecutive La Niña events. But what could this mean for soybean production in Brazil, the United States, and Argentina? This article presents descriptive analyses of deviations from the trendline of soybean yields over the last 30 years in these countries, the three largest producers and exporters of soybeans in the world, to predict what to expect from soybean yields this year. Although, the strength of individual La Niña events and various climate factors make each event unique.
La Niña Forecast Probability
La Niña is a pattern of ocean temperature and wind anomalies across the Pacific Ocean, which affects weather conditions around the world. As defined by the National Oceanic and Atmospheric Administration (NOAA), during the La Niña phenomenon the surface winds across the entire tropical Pacific are stronger than usual, and most of the tropical Pacific Ocean is cooler than normal. During La Nina events, conditions throughout South America favor increased precipitation across northern Brazil and decreased rainfall amounts in Argentina and southern Brazil. In the United States, generally speaking, wetter than normal conditions are usually found in the Pacific Northwest and midwestern region.
The Pacific Ocean has been in a La Niña phase for the last two years. The first occurred from late August 2020 to April 2021. This was followed by the current La Niña, which started in August 2021 and is still underway. La Niña is favored to continue into the Northern Hemisphere summer (59% chance during July-September 2022), and also into the Southern Hemisphere summer (57% chance December 2022 – February 2023), according to Climate Prediction Center (CPC/IRI) Official Probabilistic El Niño-Southern Oscillation (ENSO) Outlook, May 12. If it happens, it will be the third consecutive La Niña for the first time in two decades.
Important impacts of the ENSO phenomenon on world agriculture have been identified, generating losses or gains in activity according to the region and phase of the phenomenon. Iizumi et al., (2014) estimated ENSO world-level effects on the yields of main agricultural products. They reported that El Niño is likely to improve the global soybeans average yield by 2% to 5%. On the contrary, in La Niña years global average soybean yields tend to be lower than expected. Interest in the relationship between yields and ENSO is based on the possibility of having seasonal climate forecasts for a given crop cycle several months in advance.
Soybean Yields in Brazil
In Brazil, with almost all the area harvested by the third week of May, production is expected to reach 4,550 million bushels, a decrease of 10.4% in comparison to last season, according to the National Supply Company (Conab). The expected yield is 45 bushels per acre. The average soybean yield is 5.3 bushels per acre below the trend (-11%). La Nina events favor increased rain across northern Brazil and decreased rain in southern Brazil. Such has been the case this year as southern Brazil has gone deep into drought.
In the states of Rio Grande do Sul, Paraná, and Mato Grosso do Sul the yields were 42% lower than last season, according to the Conab report. These three southern states represent 38% of national soybean production. On the plus side, Mato Grosso – the largest Brazilian soybean producer – and other states from the Brazilian Midwest, North, and Northeast had a record-breaking 2021-2022 harvest (see farmdoc daily, February 25, 2022).
Brazil had very different results in soybean yields during the last two La Niña years (see last two blue dots in Figure 1). While in 2021/22 yields were below trend, in the 2020/21 season, the average soybean yield was 3.1 bushels per acre above trend (+6%), with a record production of 5,076 million bushels. This disparity can be explained by climate differences within Brazil and the wide distribution of soybean across the country, from north to south. And in the last time that three consecutives La Niña happens, in 2001, the yields were 12% above trend line.
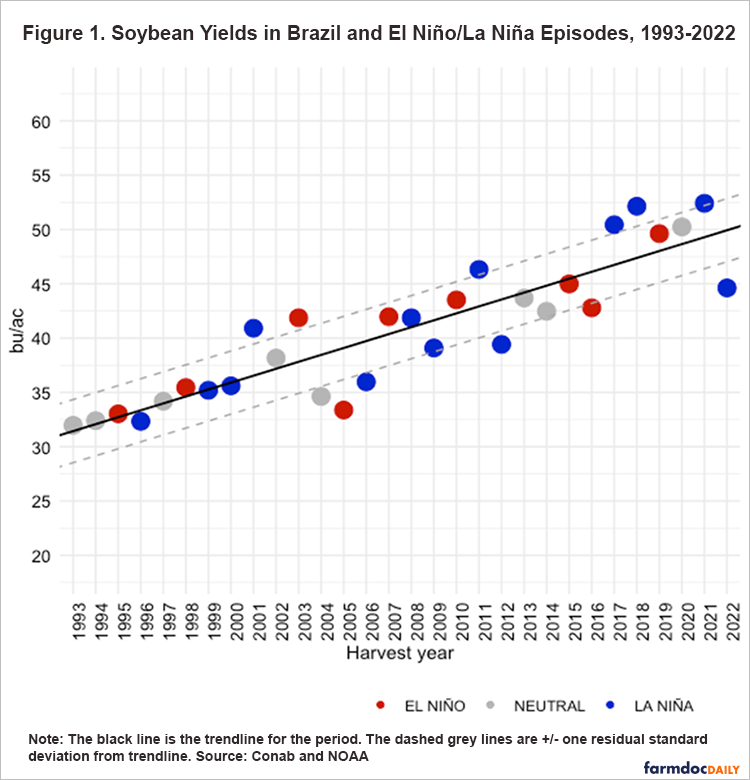
Figure 1 shows the relationship between ENSO phases and yield levels in soybeans. Note that five out of six very high yield levels (residual standard deviation from trendline greater than one) happened in La Niña crop years. In addition, two out of five very low yield levels happened in La Niña crop years, two in El Niño and one in Neutral. So, it is not possible to see a strong relationship between La Nina episodes and soybean yields level in Brazil.
Soybean Yields in Argentina
With 84% of the 2021/22 soybeans being harvested by May 19, according to the Ministry of Agriculture, Livestock and Fisheries in Argentina (MAGyP), production estimates are 1,543 million bushels, as stated by Bolsa de Cereales of Buenos Aires. And the estimated yield is approximately the same as the previous harvest, around 42 bushels per acre.
The last two La Nina episodes, 2020/21 and 2021/22 crop years, did not generate extremely low yields, however, in both cases the yield values were below the trendline by 3 bushel per acre, or -6% (see last two blue dots in Figure 2). In these two crop seasons, precipitations were below average in some parts of the Pampa region (Buenos Aires, Córdoba, Entre Rios, La Pampa and Santa Fe states), which provides 95% of soybean production in the country. And in the last time that three consecutives La Niña happens, in 2001, the yields were 7% above trend line in Argentina.

Figure 2 shows a relationship between ENSO phases and soybeans yield levels in Argentina. The majority of the red dots (yields in El Niño years) are above the trendline and the majority of blue dots (yields in La Niña years) are below the trendline. This pattern reflects the relationship reported in different studies (Casa et al., 2021; see farmdoc daily, December 17, 2020): a negative (positive) effect of La Niña (El Niño) soybeans yields in Argentina.
However, there is a high level of dispersion in the relationship. If we focus on extreme values (residual standard deviation from trendline greater than one), note that five out of six very high yield levels happened in El Niño crop years. Also, three out of four very low yield levels happened in La Niña crop years. These data suggest a very low probability of having very high yields in La Niña years and very low yields in El Niño years.
Soybean Yields in the US
In 2021, the United States soybean harvest was 4,440 million bushels, up 5% from 2020, according to the United States Department of Agricultural (USDA). With record high yields in 21 states, the average soybean yield was 51.4 bushels per acre, 0.4 bushel above 2020 and the second highest on record. The last two La Nina episodes’, harvests 2020 and 2021 crop years, soybean yields were above trendline by 1.4 and 1.5 bushels per acre, or 3%, respectively (see last two blue dots in Figure 3). And in the last time that three consecutives La Niña happens, in 2001, the yields were 2% below trend line.

Figure 3 shows a slight relationship between ENSO phases and soybeans yield levels in the US, with the majority of the red dots (yields in El Niño years) above the trendline. This pattern reflects the relationship reported in other studies (Iizumi et al., 2014), a positive effect of El Niño on U.S. soybean yields. Climatologists of El Niño events have been developed over the past several decades and have found that in general, warmer and slightly drier wintertime conditions occur in the Midwest during El Niño.
If we focus on extreme values (residual standard deviation from trendline greater than one), note that two out of three very high yield levels happened in El Niño crop years and one in a La Niña year. Also, three out of four very low yield levels happened in Neutral years, and only one in a La Niña year. Therefore, this is evidence of a weak effect of ENSO on US soybean yields.
Summary
This report analyzes the relationship between soybeans yields and ENSO phases from 1992 to 2022 for Brazil, US and Argentina, the main world producers and exporters. Soybean yields in the last crop years, both under La Niña conditions, show dissimilar results between countries and crop years. A very low yield (11% below trendline) occurred in Brazil for the last harvest, and a yield above trendline was obtained in the previous one (+6%). In Argentina yields were below the expected values for both years (-6%) and in the US above the trendline (+3%).
Over the last 30 years, the data show a strong relationship between ENSO episodes and soybean yield levels in Argentina and a weaker relationship in the U.S. and no relationship is Brazil. It is important to highlight each La Niña event is different in terms of strength, duration, and direct impacts. So, the prediction of the impacts on soybean yields is not easy.
References
Bolsa de Cereales of Buenos Aires, Argentina, 2022. Agricultural Estimations. https://www.bolsadecereales.com/estimaciones-informes
Center, Midwestern Regional Climate. National Centers for Environmental Information (NCEI) and Purdue University. Midwest Climate: El Niño 2015-2016. https://mrcc.purdue.edu/mw_climate/elNino/impacts.jsp
Colussi, J., G. Schnitkey and C. Zulauf. "Soybean Prices Rise as Drought in South America Reduces Harvest." farmdoc daily (12):26, Department of Agricultural and Consumer Economics, University of Illinois at Urbana-Champaign, February 25, 2022.
Conab, National Supply Company. “Monitoring the Brazilian Grain Crop.” Brasília, DF, v. 9, 2021/22 crop season, n.8, May 2022. Available in https://www.conab.gov.br/info-agro/safras/graos/boletim-da-safra-de-graos
de la Casa, A. C., Ovando, G. G., & Díaz, G. J. (2021). ENSO influence on corn and soybean yields as a base of an early warning system for agriculture in Córdoba, Argentina. European Journal of Agronomy, 129(September 2020), 126340. https://www.sciencedirect.com/science/article/pii/S1161030121001118
Estimaciones Agrícolas. Ministerio de Agricultura, Ganadería y Pesca, Argentina. https://www.magyp.gob.ar/sitio/areas/estimaciones/_archivos/estimaciones/220000_2022/220500_Mayo/220505_Informe%20Semanal%20al%2005-05-2022.pdf
Irwin, S. "The Impact of Preseason La Niña Episodes on Corn and Soybean Yields in Brazil and Argentina." farmdoc daily (10):213, Department of Agricultural and Consumer Economics, University of Illinois at Urbana-Champaign, December 17, 2020.
National Oceanic and Atmospheric Administration U.S. Department of Commerce (NOAA). Climate Prediction Center (CPC). https://origin.cpc.ncep.noaa.gov/products/analysis_monitoring/ensostuff/ONI_v5.php
Disclaimer: We request all readers, electronic media and others follow our citation guidelines when re-posting articles from farmdoc daily. Guidelines are available here. The farmdoc daily website falls under University of Illinois copyright and intellectual property rights. For a detailed statement, please see the University of Illinois Copyright Information and Policies here.