


What Is the Deferred Tax Monster and How It Has Been Changing over Time?
Farmland prices and machinery values began to increase in 2020 and those values really took off in 2021. In addition to this, we saw increased commodity prices. All of these have led to increases in earnings and in turn increased growth in net worth for Illinois farmers. With these increases are there added items that farmers need to think about that can be lurking and only come out when farmers sell, retire or transfer ownership of some of these assets (or their heirs)? Yes, it is the deferred tax monster.
Because agriculture producers can use cash accounting for federal and state income tax purposes, there is a recognizable difference between taxable farm income and accrual farm income. These differences can have an immense impact on tax liability, earnings, and net worth not always recognized on farm financial statements. Part of your operations annual business assessment should include calculating the amount of deferred tax liability, in order to be well aware of the possibilities that could be triggered.
Deferred taxes are the result of reconciling the tax basis of balance sheet assets and the market value of the same assets. A situation that might require a farmer to sell all assets at the same time is not typical, but if that was the case, what might be the resulting tax liability? By estimating your deferred tax liability, you can be more knowledgeable of the how your farm business would be affected.
For this work, we have taken a group of farms from the Illinois FBFM database and made some assumptions on tax rates. The current part of estimated average deferred tax liabilities includes self-employment tax as well as income tax. Favorable capital gain tax rates are used where appropriate along with ordinary income tax rates in the calculation of estimated average deferred taxes on intermediate and long term assets.
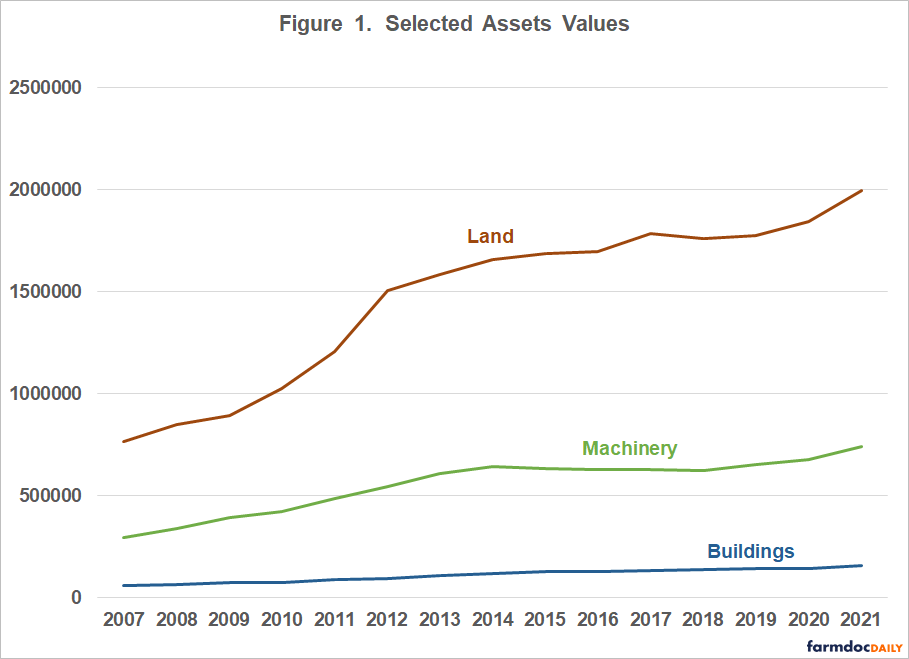
Figure 1 depicts the increases in average values for machinery, buildings and land. The increases in values for machinery and buildings are trumped by the increases in land values. The increase in values for machinery is in part due to the use of the IRS Code Section 179 Expense Election and Bonus Depreciation. Since 2019, much of the machinery increase has been due to the increase in prices of the machinery. The average land value on Illinois FBFM farms is typically conservative in comparison to the true market value, so the total value maybe low, however the trend over time has been true, due to the stead increase in farmland values. In the last two years, values have increased the most for machinery and land since the 2009 to 2012 period.
In Figure 2, the increase in average deferred tax liabilities in the past fifteen years is shown by the type of asset. Prior to 2007 and the ethanol mandate, the three asset types were increasing at similar rates but not at the rates experienced in later years. From 2007-2012, there is much variation in the current part of the deferred tax liability and that variation occurs at a generally higher level. Causes for this include the increased value of crop in inventory due to generally higher prices. From 2013 to 2019, the estimated tax liabilities by type of asset stayed about the same, mainly due to similar values of assets and lower commodity prices. After 2019, much higher prices for commodities have led to a larger increase in the current portion of estimated deferred tax liability.
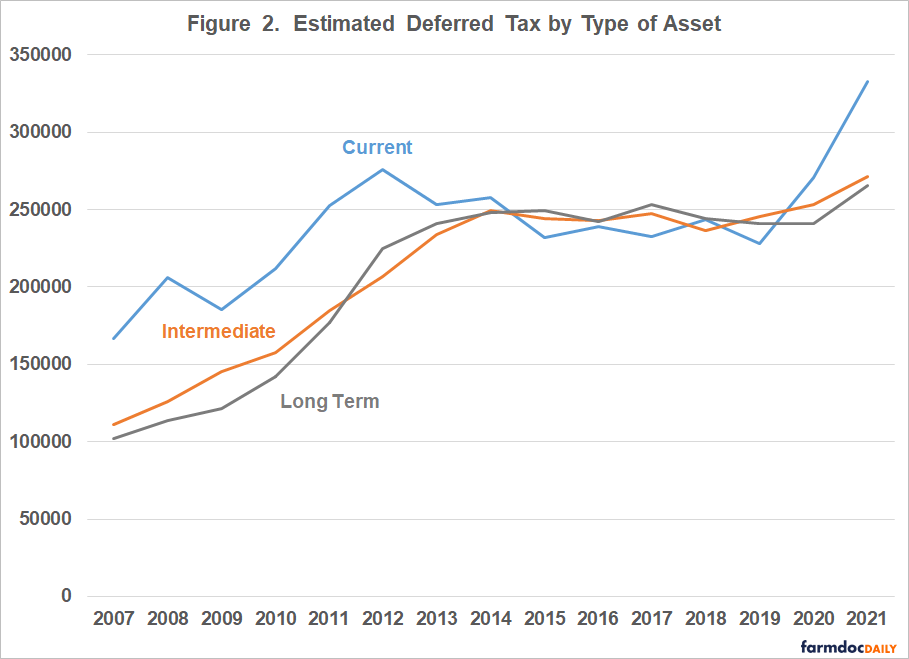
Figure 2 also shows that the intermediate and long-term part of deferred tax liabilities was increasing at a steadier rate and without the volatility seen in the current part of the deferred tax liability from 2007 to 2012 as well. As with the current part of the deferred tax liability, beginning in 2013 the increase in intermediate and long-term deferred taxes leveled off. However, as with the current portion, intermediate and long-term parts have begun increasing the last two years as well. Over the fifteen years shown on Figure 2, the average annual increase in deferred taxes is $35,039.
In production agriculture, it is customary to prepare financial statements without the presence of the deferred tax liability. In turn, we review our ratios and benchmarks without recognizing the tax liability as well. Keep in mind that there is a ‘claim’ on your net worth due to your deferred tax liability – we just don’t typically recognize it. Some believe that deferred tax is not real and prefer to look at financials without it present. They may be true, but events that can trigger deferred tax liabilities need to be acknowledged considering the impact this might have on your financial condition.
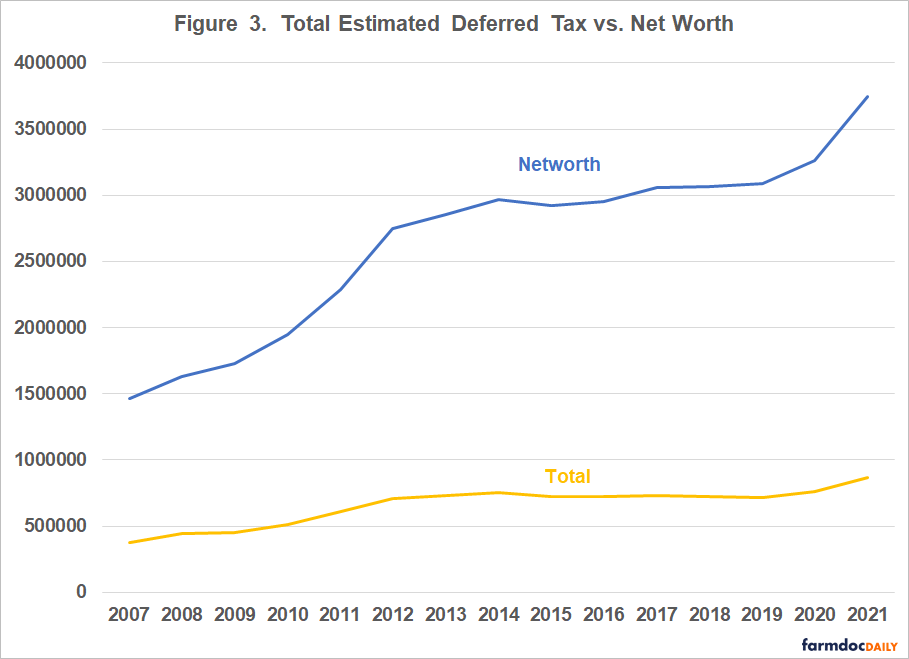
Figure 3 shows estimated deferred taxes as compared to net worth. In percentage terms, 2008 deferred tax was 27.3% of net worth – which was the high – while 2021 recorded deferred tax as 23.2% of net worth.
Summary
The waistline of the deferred tax monster has increased over time. It also appears that the rate of increase in the accumulation of deferred tax liabilities is lessened for awhile, but over the most recent two-year period, there has been an uptick due to higher commodity prices, machinery and farmland values. With inflation pressures and added volatility in the agricultural economy, time will tell if there will be increases in deferred tax liabilities in the coming years or if we will level off again.
The authors would like to acknowledge that data used in this study comes from the local Farm Business Farm Management (FBFM) Associations across the State of Illinois. Without their cooperation, information as comprehensive and accurate as this would not be available for educational purposes. FBFM, which consists of 5,000 plus farmers and 70 professional field staff, is a not-for-profit organization available to all farm operators in Illinois. FBFM staff provide counsel along with recordkeeping, farm financial management, business entity planning and income tax management. For more information, please contact the State FBFM Office located at the University of Illinois Department of Agricultural and Consumer Economics at 217.333.8346 or visit the FBFM website at www.fbfm.org.
Disclaimer: We request all readers, electronic media and others follow our citation guidelines when re-posting articles from farmdoc daily. Guidelines are available here. The farmdoc daily website falls under University of Illinois copyright and intellectual property rights. For a detailed statement, please see the University of Illinois Copyright Information and Policies here.