


Safety Nets from Crop Insurance in 2023
The Risk Management Agency (RMA) has released 2023 projected prices for crop insurance. For Illinois and most Midwest states, projected prices are $5.91 per bushel for corn and $13.76 for soybeans. Those projected prices are some of the highest in history and will provide solid safety nets. Still, many operations will face losses before crop insurance guarantees make payments.
Background
Projected prices are used to set guarantees on revenue crop insurance products. In addition, yield insurance products use projected prices to determine the value of yield losses. In Illinois, over 90% of the acres are insured using Revenue Protection (RP), a farm-level revenue product that has a guarantee increase. As a result, the discussion below will focus on RP.
Projected prices are based on Chicago Mercantile Exchange (CME) contract settlement prices. For corn and soybeans, the average settlement prices during February are used in Midwest states. The December CME is used for corn. The November CME contract is used for soybeans.
Those same contracts are used to determine harvest prices. For RP, harvest prices are used in revenue guarantee calculation if the harvest price is above the projected price. The harvest price also is used in calculating revenue for determining insurance payments. Harvest prices are the average settlement prices during October.
Also, in February, volatilities for crop insurance products are set. Volatilities are based on values from the last five days of February. The volatility influences premiums on revenue products. A higher volatility means there is less certainty about prices in the future. As a result, prices of revenue products increase with higher volatility.
2023 Projected Prices
The 2023 projected price for corn is $5.91 per bushel, $.01 more than the 2022 projected price (see Figure 1). Overall, the 2023 projected price is the second highest ever, exceeded only by $6.01 per bushel for the 2011 crop.

The 2023 corn volatility is .18, significantly below the .23 volatilities in 2021 and 2022. The lower 2023 volatility will lower premiums. For 85% RP policies at the enterprise level, premium reductions could be between $5 and $6 per acre with a .18 instead of .23 volatility.
The 2023 projected price for soybeans is $13.76 per bushel (see Figure 2). The 2023 price is $.57, below the 2022 projected price of $14.33. Still, the 2023 price is the second highest after the 2022 projected price.
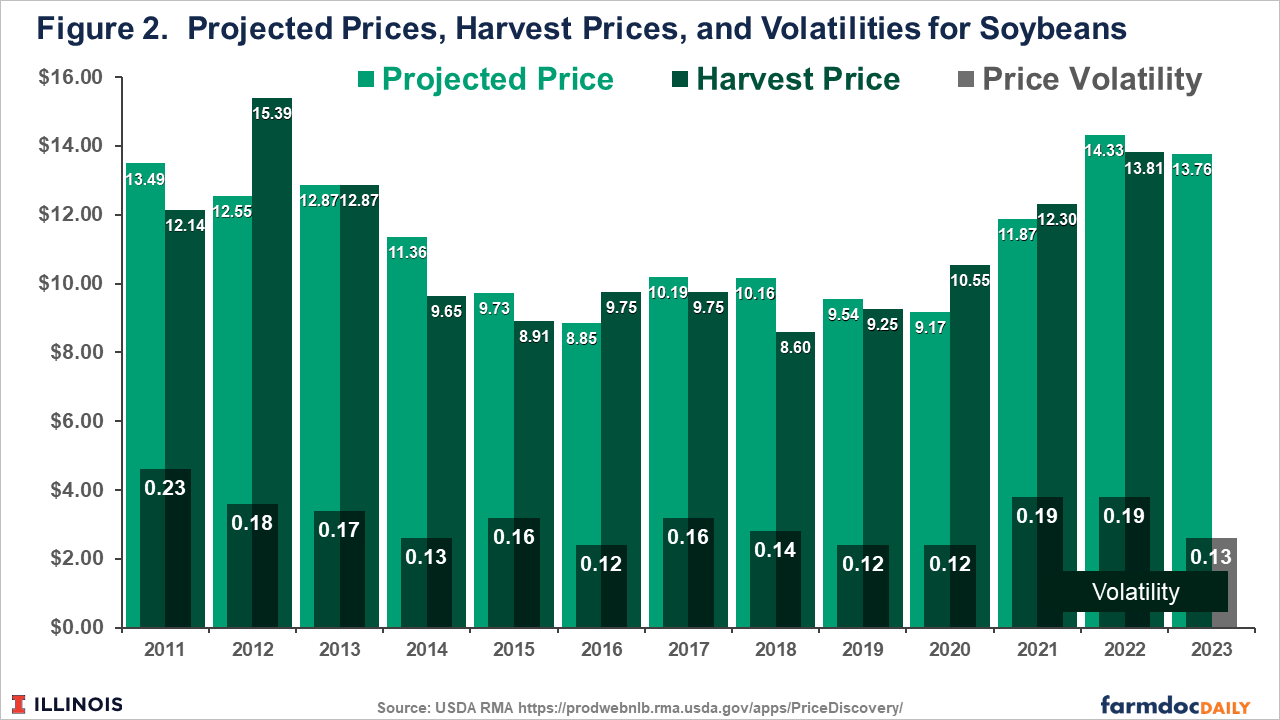
The 2023 soybean volatility is .13, well below the .19 volatilities for 2021 and 2022. Similar to corn, lower soybean volatility will lower premiums. For 85% RP policies at the enterprise level, premium reductions could be between $4 and $5 per acre.
Guarantees Offered by Crop Insurance
RP’s guarantee equals:
- Trend-adjusted Actual Production History (TA-APH) yield
- x Higher of projected or harvest prices
- x coverage level
Three notes on the above equation:
- TA-APH yield is used in most situations. TA-APH is available through an endorsement, which the majority of farmers use. The TA endorsement increases yields by a trend-adjustment. If the TA endorsement is not used, then the APH is used in the calculation. Both the TA-APH and APH yields are based on a history of yields from an insurance unit.
- RP uses the higher of the projected or harvest price in its guarantee calculation. Because the harvest price is not known till the end of October, the guarantee is not known. However, after the projected price is set, a minimum revenue guarantee can be calculated.
- For corn and soybeans in Midwest states, coverage levels range from 50% to 85% in 5% increments.
A typical central Illinois farm has a 230 bushel per acre TA-APH yield. Given an 85% coverage level, this farm would have an insurance guarantee of $1,155 per acre (230 yield x $5.91 projected price x .85 coverage level).
Projected prices typically overstate the cash prices farmers will receive. Projected prices are based on future prices. Typically, cash prices are below futures prices. A basis of -$.30 per bushel is typical for corn and soybeans in central Illinois. Given a -$.30 basis, a $5.91 projected price translates into a $5.61 cash price. A $1,155 crop insurance guarantee then translates into less when stated in terms of cash prices. Using a $5.61 cash price, the minimum cash guarantee for an 85% coverage level is $1,097 (230 yield x (5.91 projected price – .30 basis) x .85).
Minimum Cash Guarantees
Table 1 shows minimum cash guarantees for different coverage levels given the above example for corn (230 TA-APH price, $5.91 projected price, -$.30 basis). Minimum cash guarantees range from $1,097 per acre for an 85% coverage level to $774 per acre for a 60% coverage level.
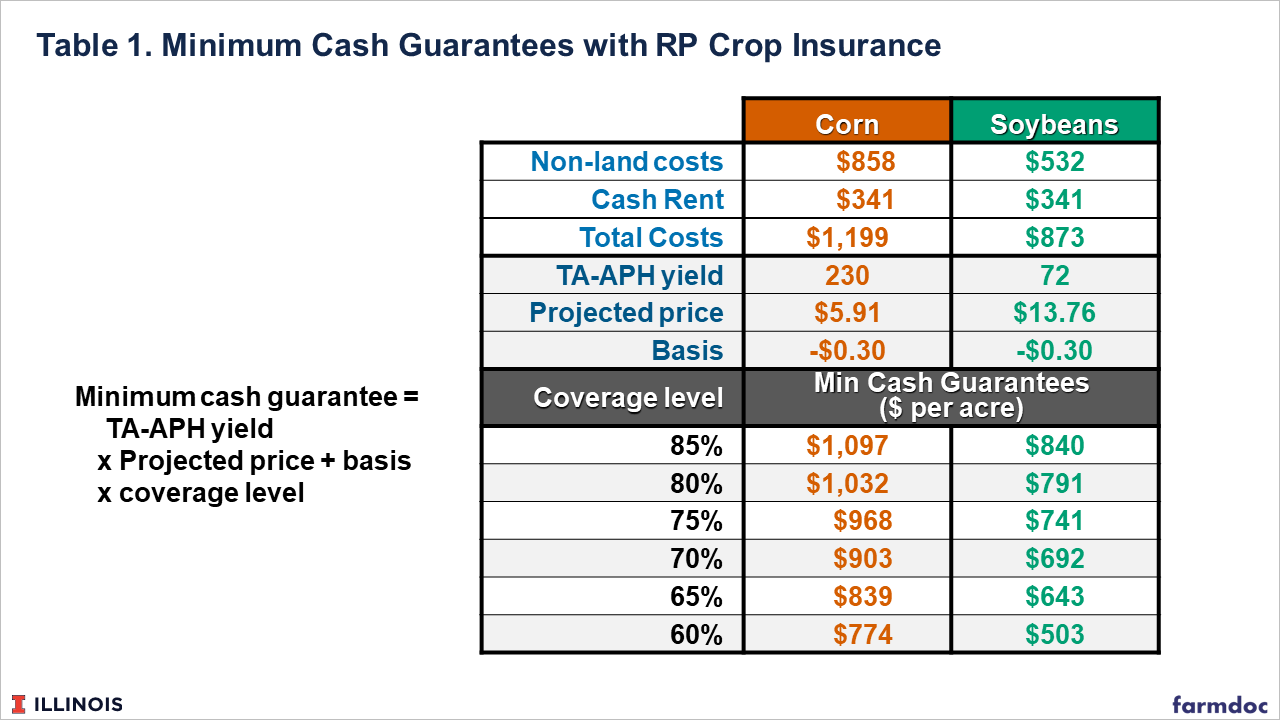
In University of Illinois budgets, non-land costs of corn are estimated at $858 per acre. Given a $341 cash rent, total costs are $1,199 per acre. Those costs are above all minimum cash guarantees. At an 85% coverage level, the $1,097 cash guarantee is $102 per acre less than the total costs. While the 85% coverage level provides valuable coverage, it does not guarantee positive returns. Much higher costs contribute to the potential for losses.
Table 1 also shows the calculation of minimum cash guarantees for soybeans. A 72 bushel per acre TA-APH yield is used in calculations. A $13.46 cash price results from a $13.76 projected price and a -$.30 basis. Cash guarantees range from $840 per acre for an 85% coverage level down to $503 per acre for a 60% coverage level.
University of Illinois budgets project non-land costs at $532 per acre. Given a $341 cash rent, total costs are $873 per acre. Total costs in this situation are above the minimum cash guarantee.
Summary
Crop insurance will provide valuable safety nets to farmers in 2023, with projected prices at relatively high levels. Still, high costs could cause losses even if 85% coverage level RP is selected. There are risks of losses on grain farms in 2023 even with crop insurance coverage.
Disclaimer: We request all readers, electronic media and others follow our citation guidelines when re-posting articles from farmdoc daily. Guidelines are available here. The farmdoc daily website falls under University of Illinois copyright and intellectual property rights. For a detailed statement, please see the University of Illinois Copyright Information and Policies here.