


Cost of Production and Farm Policy: Part I
The higher cost to produce crops continues to be a focus of the farm bill debate. This article begins a 2-part exploration of US cost to produce crops. Over the last 50 years, land’s share of the economic cost of production has changed the most of any input. It has declined, with most of the decline occurring during the farm financial crisis of the early and mid-1980s. Since then, land’s share has fluctuated around 18%. Farmers have thus bid up land rents at the same rate as the increase in non-land costs as a group. This finding implies that, to the extent farmers bid government payments into land, they also bid them into all other inputs as a group, thus keeping land’s share of economic costs stable. The study also found that change in per acre cost varies notably across inputs and for a given input across crops. Including only selected inputs in a cost of production adjustment thus will likely favor some crops and hurt others. Total economic cost to produce a crop is likely to result in the most equitable treatment of all crops since it includes all inputs.
Data and Methods
Cost of production data in this study are from USDA, ERS (US Department of Agriculture, Economic Research Service) while yield data are from QuickStats maintained by USDA, NASS (National Agricultural Statistics Service). ERS compiles cost of production for barley, corn, cotton, oats, peanuts, rice, sorghum, soybeans, and wheat. Cost starts with the 1975 crop year. The last crop year with complete data is 2022. ERS assigns a cost to all inputs except management, including an opportunity cost to unpaid labor and farmer-owned land. It is thus an economic cost of production. Quantity of inputs is based on periodic surveys of farms. Input prices are updated annually using prices from NASS surveys. In our judgement the ERS data are a reasonable measure of the cost to produce a crop in the US. We however encourage readers to examine the detailed discussion in Zulauf, Langemeier, and Schnitkey (2020) and form their own opinion.
Change in ERS Cost Methods
Beginning in 1995, the methods used by ERS to estimate economic costs and net returns per planted acre were adjusted to reflect recommendations of an American Agricultural Economics Association Task Force on Commodity Costs and Returns. USDA, ERS Documentation material contains a detailed discussion of the task force’s recommendations and changes implemented. The changes were largely changes to the methods used to value a resource, not the addition or removal of cost items. Three of the more important changes were (1) using the wage rate of farm operators working off-farm instead of a state’s wage rate for agricultural workers to estimate opportunity cost of unpaid labor, (2) using only cash rent instead of a weighted average of cash and share rent to estimate opportunity cost of land, and (3) changing the method used to estimate capital costs incurred in production. Implementation of the new methods was staggered over time by crop as follows: 1995, sorghum and peanuts; 1996, corn; 1997, cotton and soybeans; 1998, wheat; 2000, rice; 2003, barley; and 2005, oats.
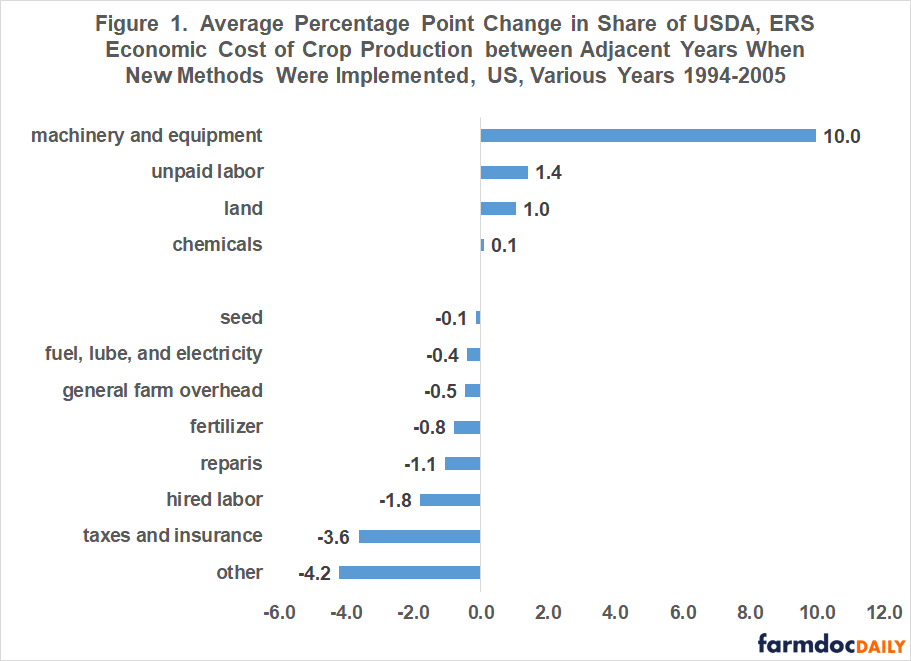
A variation of what economists call event studies was used to estimate the impact of the change in cost of production accounting methods. The event was the implementation of the new method. For each crop, the change in an input’s share of total cost was computed for the two years that bracketed the implementation of the change in method for the crop. For example, the two years for corn were 1996 and 1997. The adjacent year change in shares was averaged across the 9 crops.
Largest average change in share of economic cost of production was a 10 percentage point (pp) increase in the share of cost assigned to machinery and equipment. This change was the result of the change in the method used to estimate capital costs incurred in production. The use of only cash rent resulted in a 1 pp increase in land’s share of the cost of production while the change in valuation of unpaid labor increased its share by 1.4 pp. Largest decline was a -4.2 pp decline in the share for the other input category and a -3.6 pp decline in the share of taxes and insurance. The values in Figure 1 are used to calculate the values in Figure 2.
Change in Input Shares
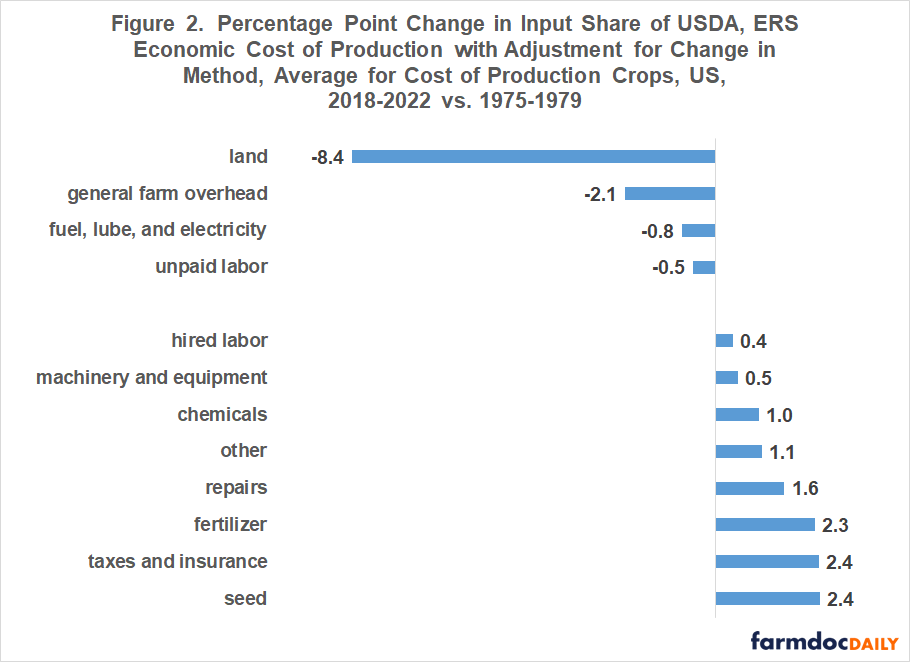
An input’s average share of total economic cost was calculated for 1975-1979 and for 2018-2022. Change in input share was then calculated as the 2018-2022 average share minus the 1975-1979 average share. This percentage point change was then adjusted to remove the percentage point change calculated for the change in method. For example, for land the 7.4 percentage point decline calculated between 1975-1979 and 2018-2022 was reduced by another 1 percentage point since the change in cost accounting methods increased land’s share by 1 percentage point (see Figure 1).
For the 9 crops as a group, the change in input share of economic cost of production from 1975-1979 to 2018-2022 ranged from a -8.4 pp decline for land to a 2.4 pp increase for seed and for taxes and insurance (see Figure 2). Shares also declined for general farm overhead; fuel, lube, and electricity; and unpaid labor while increasing for hired labor, machinery and equipment, chemical, repairs, fertilizer, and other. Total labor share of economic cost changed little (-0.1 pp = -0.5 pp + 0.4 pp). Share of off-farm inputs increased by 8.9 pp as the share due to land and unpaid labor declined by an equivalent amount.
Land’s Share of Economic Cost
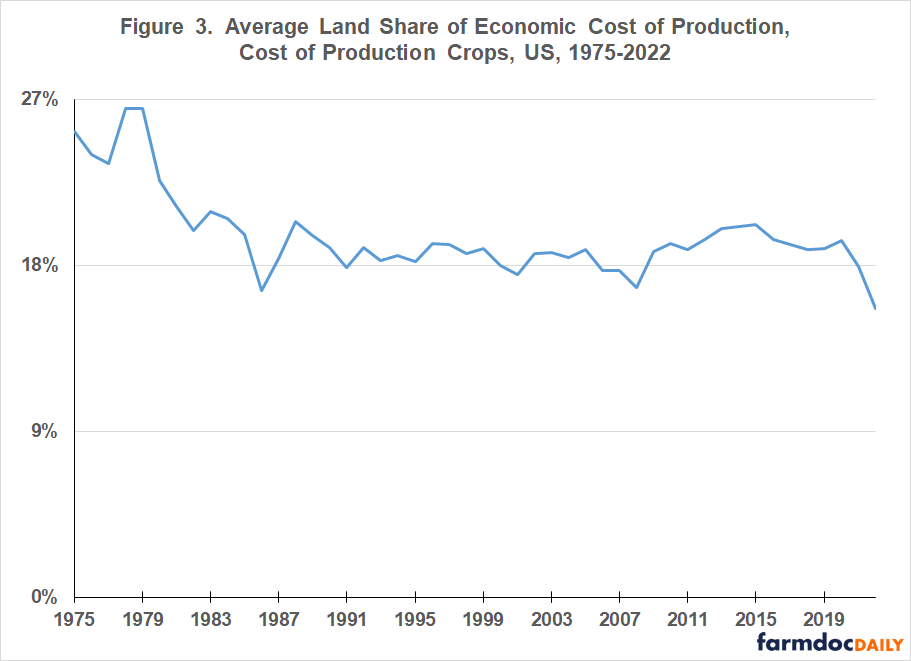
We further explored the large decline in land’s share. Land’s share of economic cost declined from an average for the 9 crops of 26% at the end of the 1970s to 18% by the mid-1980s, a decline associated with the farm financial crisis of the early 1980s (see Figure 3). Land’s average share has since fluctuated around 18%. Land’s 16% share for 2022 is the lowest over the study period. The previous low was 17%, which occurred in 1986 during the farm financial crisis and in 2008 during an early year in the farm prosperity period of 2007-2013. Both the 2008 and 2022 crop years had a large increase in non-land cost due to rising non-land input prices. The stable land share since the mid-1980s suggest that farmers have been reluctant to bid up land rental rates faster than the average increase in cost of crop inputs as a group.
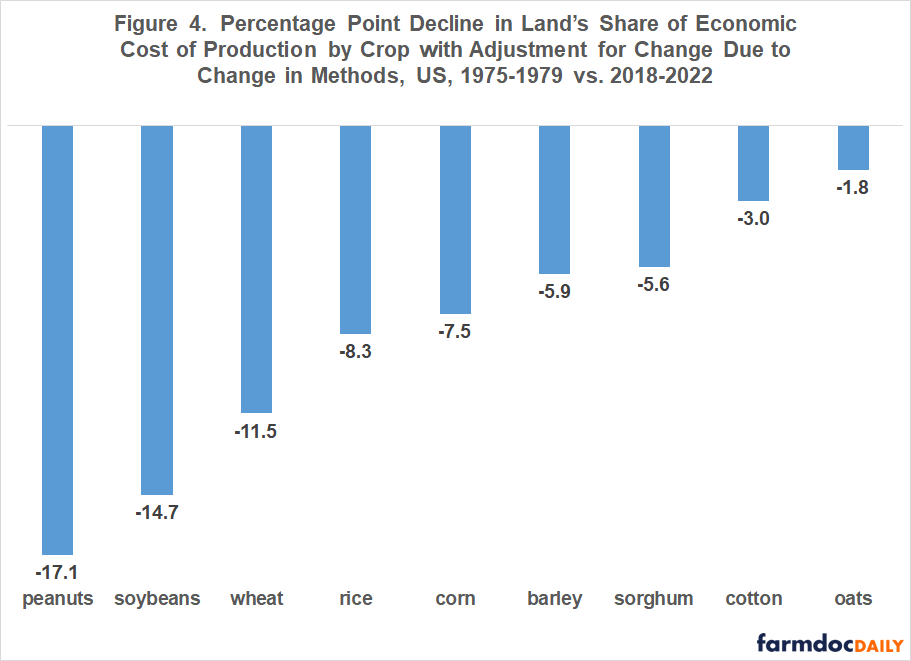
Land’s share of economic cost also declined for each individual crop (see Figure 4). The decline however varied notably by crop, ranging from -17.1 pp for peanuts to -1.8 pp for oats.
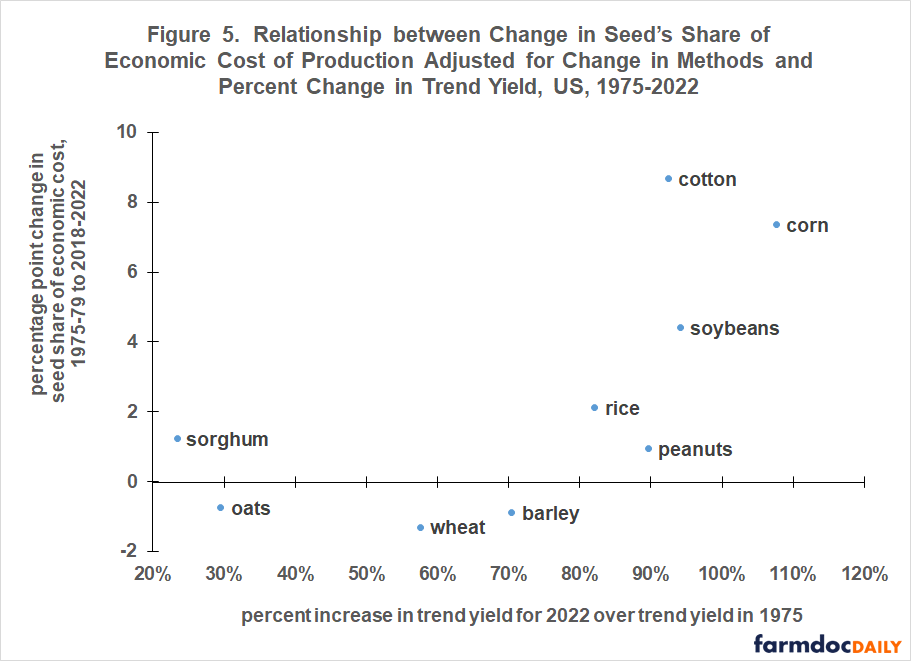
Seed’s Share of Economic Cost
A wide range of change in share of economic cost across crops is a common feature for an input category. To illustrate, the change in seed’s share of economic cost by crop ranged from an 8.7 pp increase for cotton to a -1.3 pp decline for wheat (see Figure 5).
Figure 5 also explores the relationship between change in seed share and yield over 1975 – 2022. A linear time trend was estimated for each crop’s harvest yield per acre. Using this estimated relationship, a trend yield was calculated for 1975 and 2022. Percent increase in the two trend yields was then calculated.
There is little-to-no relationship between the change in seed’s share of economic cost and the 1975-2022 increase in trend yield until the increase exceeds 90%. For the 6 crops with a trend yield increase of less than 90%, change in seed’s share of economic cost averaged +0.22 pp. For the 3 crops whose yield increased more than 90%, seed’s share of economic cost increased by 4.4 pp for soybeans, 7.4 pp for corn, and 8.7 pp for cotton. While caution is needed since there are only 3 crops, the higher the increase in trend yield for these 3 crops the higher the increase in seed’s share of economic cost. The relationships in Figure 5 suggest that the price of seed likely contains a yield premium, but only when yield growth exceeds a base value.
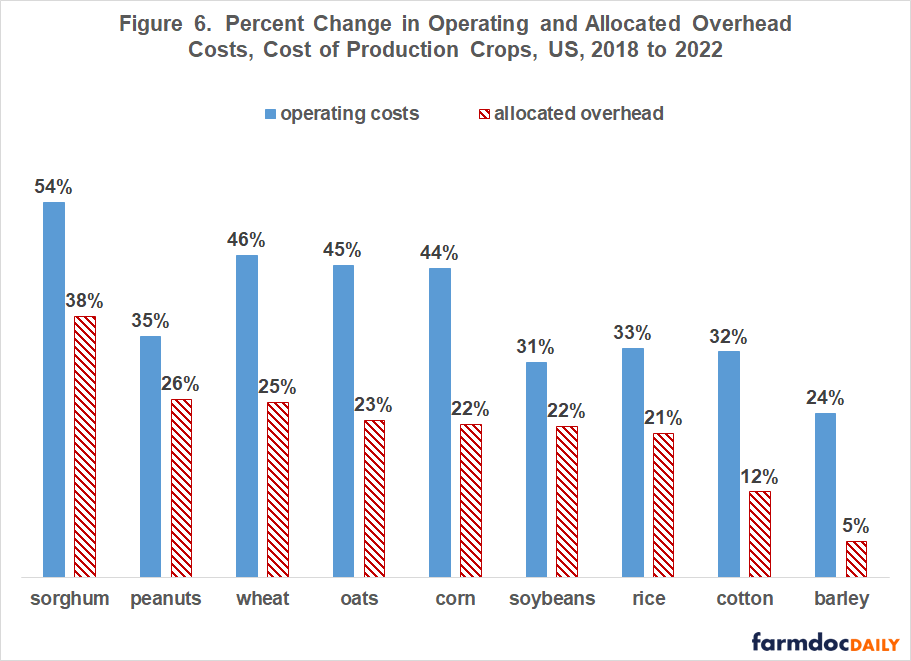
Change in Input Cost per Acre by Crop over 5 Years
The preceding discussions highlight differential changes in the cost per acre of crop inputs over a period of nearly 50 years. This section examines differential changes over a shorter period, specifically a 5-year span that is common for farm bills. Percent change in cost per acre is calculated by crop for the two broad categories ERS uses to classify inputs: operating costs and allocated overhead. Allocated overhead is composed of hired labor, opportunity cost of unpaid labor, capital recovery of machinery and equipment, opportunity cost of land, taxes and insurance, and general farm overhead. All other inputs are classified as operating costs.
Percent change in operating costs and allocated overhead are computed by dividing cost per acre in 2022 by cost per acre in 2018. Once again notable differences exist across crops. For operating costs, the range is an increase of 54% for sorghum to 24% for barley. For allocated overhead, the range is an increase of 38% for sorghum to 5% for barley. Differential changes in these input categories for a given crop is also notable. Smallest differential change is for cotton at 9 pp (35% minus 26%). Largest differential change is 22 pp for oats (45% minus 23%), or more than twice cotton.
Discussion
The cost to produce crops continues to receive considerable attention in the farm bill debate. It is important to understand any policy variable if policy or a change in policy is to be designed effectively.
Since 1975, land’s share of US economic cost of producing crops has changed the most of any input. It has declined, with most of the decline occurring during the farm financial crisis of the early and mid-1980s. Since then, land’s share has exhibited no trend, fluctuating around 18%. This stable share implies that farmers have bid up land rents at the same rate that the cost of non-land inputs as a group have increased.
A long-standing argument regarding the farm safety net is that farmers bid safety net payments into the price of land. The empirical observation that land’s share of economic cost has basically remained stable since the mid-1980s suggests this argument needs to be amended. To the extent farmers bid safety net payments into land, they also bid them into all other inputs as a group, thus keeping land’s share of economic cost stable.
The amended argument makes conceptual sense. In the mid-1970s farm programs began to evolve into payment programs that did not require land to be set aside as an entitlement criteria. The transition was completed with enactment of freedom to farm in the 1996 farm bill. Because the safety net entitlement criteria is now a farm with a past history of producing a covered commodity, it is likely that farmers treat farm safety net payments as a return to crop farming, not to land. Hence, government payments are likely to be bid into the price of all inputs.
This study also found that changes in cost can vary notably across inputs and for a given input across program crops. The finding holds for the length of a farm bill and longer periods.
A farm policy implication of the preceding point is that, should Congress decide to include a cost of production adjustment factor in setting farm program parameters, an adjustment factor that includes only selected inputs will likely favor some crops over the life of the farm bill. The most equitable treatment of all program crops is likely to be a cost of production adjustment factor using total economic cost of production since all inputs to produce a crop are included.
References and Data Sources
US Department of Agriculture, Economic Research Service. May 2023. Cost of Production. https://www.ers.usda.gov/data-products/commodity-costs-and-returns/
U.S. Department of Agriculture, Economic Research Service. May 2023. Documentation: USDA Cost of Production Data. https://www.ers.usda.gov/data-products/commodity-costs-and-returns/documentation/
US Department of Agriculture, National Agricultural Statistics Service. May 2023. QuickStats. https://quickstats.nass.usda.gov/
Zulauf, C. M. Langemeier, and G. Schnitkey. 2022. U.S. Crop Profitability and Farm Safety Net Payments since 1975. Journal of the American Society of Farm Managers and Rural Appraisers. Pages 60-69. https://www.asfmra.org/resources/asfmra-journal
Disclaimer: We request all readers, electronic media and others follow our citation guidelines when re-posting articles from farmdoc daily. Guidelines are available here. The farmdoc daily website falls under University of Illinois copyright and intellectual property rights. For a detailed statement, please see the University of Illinois Copyright Information and Policies here.