


European Union Self Sufficiency in Grains and Oilseeds since 1980
This article examines the grain and oilseed crop production sector in the European Union (EU) since 1980. A similar analysis for the United States (US) was presented in the November 21, 2022 farmdoc daily. EU combined grain and oilseed trend yield is growing faster than the increase in yield needed to meet the trend increase in combined use. The EU thus has a surplus yield gap. As a result, the EU has reduced its land in grains and oilseeds since the late 1980s. In contrast, the US has a deficit yield gap. Its land in grains and oilseeds has been stable.
Data
The data in this article are from the Production, Supply, and Distribution Online (PSD) database managed by the US Department of Agriculture, Foreign Agriculture Service. Feed grains are barley, corn, millet, oats, and sorghum. Food grains are rice, rye, and wheat. Oilseeds are cottonseed, peanuts, rapeseed, soybeans, and sunflowers.
Use
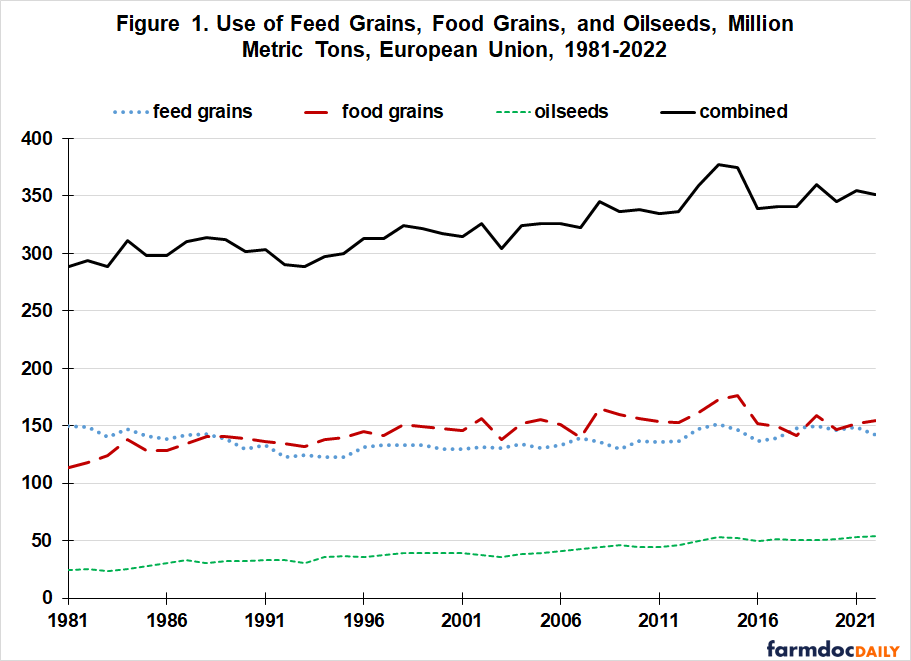
Use (domestic consumption plus exports) of EU oilseeds and food grains was 122% and 36%, respectively, higher in 2022 than in 1981 (see Figure 1). In contrast, use of EU feed grains fluctuated around 150 million metric tons per year with no trend. Comparable values for the US were increases of 97% for oilseeds and 69% for feed grains. Food grain use declined by 23%.
Combined use of EU produced feed grains, food grains, and oilseeds has followed a linear trend, increasing at the rate of 1.7 million metric tons per year (see Figure 1). Combined use was 22% higher in 2022 than in 1981, an increase of approximately 0.5% per year.
Yield
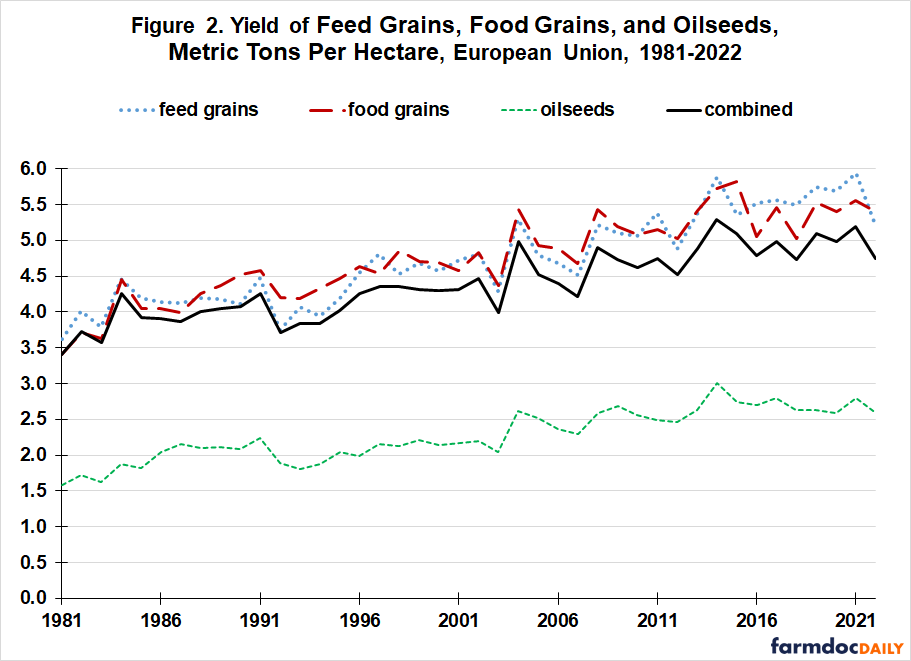
Average yield of EU feed grains, food grains, and oilseeds has trended higher since 1981 (see Figure 2). Their average annual rates of increase were 1.2% for feed grains, 1.4% for food grains, and 1.5% for oilseeds. Comparable averages for the US were 2.3% for feed grains, 1.1% for food grains, and 1.8% for oilseeds. Combined average annual rate of increase since 1980 was 1.1% for the EU and 1.9% for the US (see farmdoc daily, November 21, 2022). Each EU and US yield trend since 1980 for these three crop categories has been linear.
Yield Gap
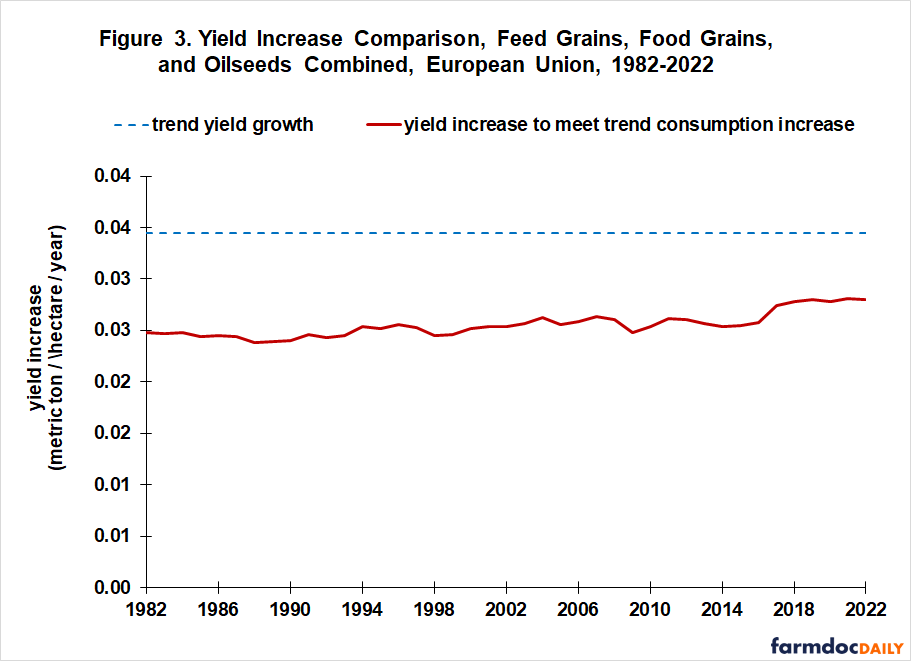
Figure 3 presents the increase in trend yield per year for the combined EU production of feed grains, food grains, and oilseeds. Also presented is the increase in yield needed to satisfy the trend increase in the combined use of these crops assuming land harvested is the same as in the preceding year (i.e. no increase in harvested land). See Data Note 4 in the November 16, 2022 farmdoc daily for an example of this calculation. The increase in EU combined trend yield has always exceeded the increase in yield needed to meet the combined use of EU produced feed grain, food grain, and oilseeds.
Harvested Land
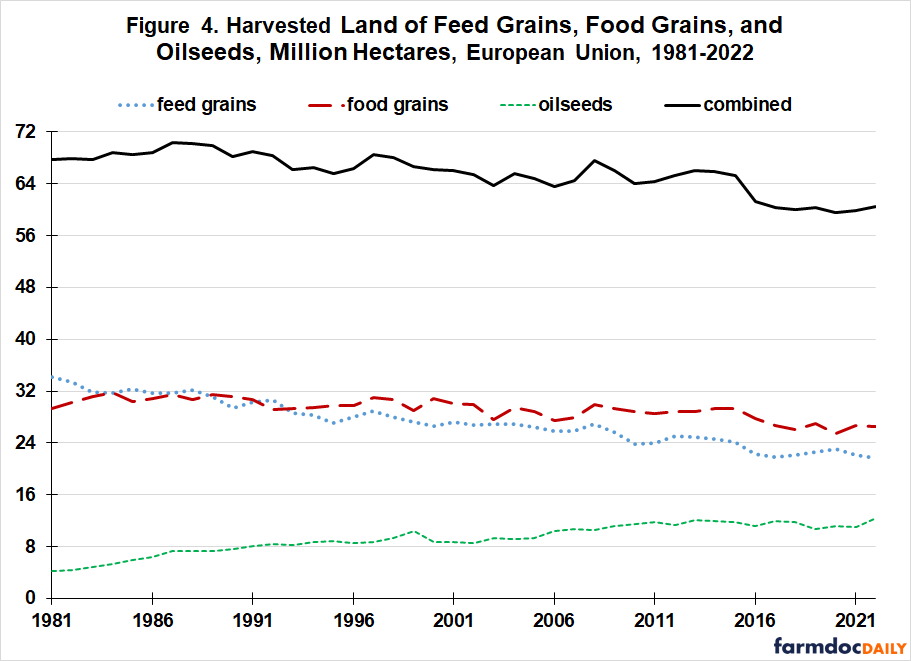
The surplus yield gap has allowed combined harvested grain and oilseed land in the EU to decline by -14% from its peak of 70.4 million hectares in 1987 to 60.4 million hectares in 2022 (see Figure 4). Harvested land has trended down for feed and food grains but up for oilseeds. Since the mid-1980s, US combined harvested land in grains and oilseeds has exhibited no trend, fluctuating around 94 million hectares or 231 million acres (see farmdoc daily, September 22, 2023).
EU Net Trade
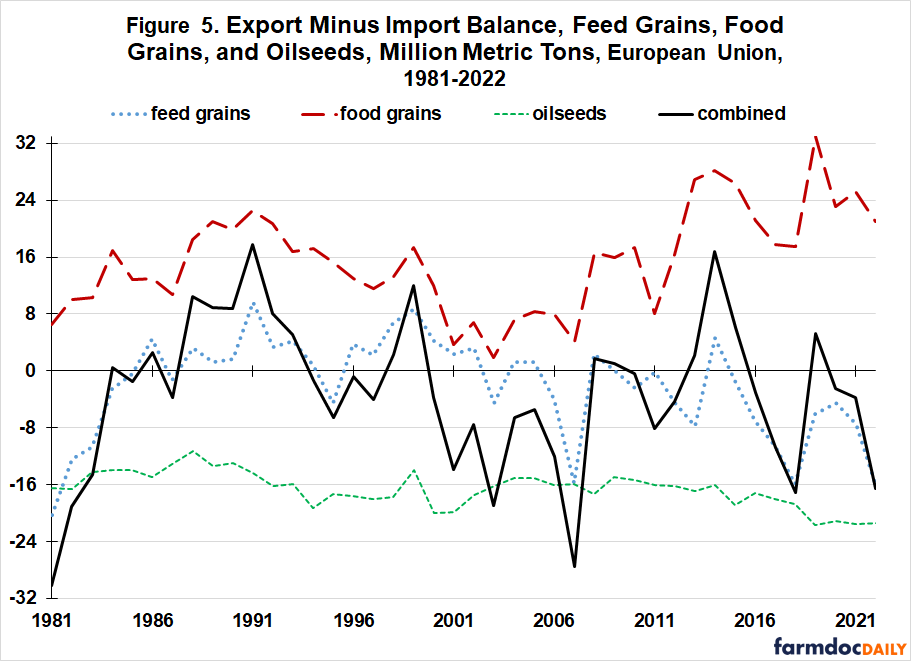
The combined EU net trade balance (exports minus imports) for feed grains, food grains, and oilseeds has averaged -1.3% of EU production since 1980 as combined imports have slightly exceeded combined exports (see Figure 5). No trend exists in the combined net trade balance. Food grains have consistently had a trade surplus. Oilseeds have consistently had a trade deficit.
Summary
Since the early 1980s, the EU has largely been self-sufficient in grains and oilseeds as a group. A surplus in food grains has largely offset a deficit in oilseeds on a quantity basis.
The EU’s annual increase in trend yield has exceeded the annual increase in yield needed to satisfy the trend increase in use, allowing it to reduce land in the EU used to produce grains and oilseeds.
Recent data suggest the EU can continue to follow its post-1980 path and thus continue to reduce land used to produce grains and oilseeds.
Impact of the EU on the international trade in grains and oilseeds has changed little since 1980 both for the individual crop categories and for combined grains and oilseeds.
References and Data Sources
US Department of Agriculture, Foreign Agriculture Service. October 2023. Production, Supply, and Distribution Online. https://apps.fas.usda.gov/psdonline/
Zulauf, C., G. Schnitkey, N. Paulson and J. Colussi. “Concentration of US Crops in Corn and Soybeans: Importance to Increasing US Production of Grains and Oilseeds.” farmdoc daily (13):173, Department of Agricultural and Consumer Economics, University of Illinois at Urbana-Champaign, September 22, 2023.
Zulauf, C. “US Feed Grain, Oilseed, and Food Grain Land since 1980.” farmdoc daily (12):176, Department of Agricultural and Consumer Economics, University of Illinois at Urbana-Champaign, November 21, 2022.
Zulauf, C. “The World’s Increasing Need for Cropped Land.” farmdoc daily (12):173, Department of Agricultural and Consumer Economics, University of Illinois at Urbana-Champaign, November 16, 2022.
Disclaimer: We request all readers, electronic media and others follow our citation guidelines when re-posting articles from farmdoc daily. Guidelines are available here. The farmdoc daily website falls under University of Illinois copyright and intellectual property rights. For a detailed statement, please see the University of Illinois Copyright Information and Policies here.