


Production Variability in the Northern Hemisphere
This article is a companion to the July 31, 2023 farmdoc daily that examined the distribution and variability of corn, soybean, and wheat production in the southern hemisphere. In aggregate, production variability is limited in the northern hemisphere. A key reason is that negative deviation from trend production in one region has not usually been related to negative deviations from trend production in other regions. Among northern hemisphere regions, production is most variable by far in the Former Soviet Union.
Data
Data were obtained for the 1977/78 (hereafter, first year is used) – 2022 crop years from the Production, Supply, and Distribution Online database (U.S. Department of Agriculture, Foreign Agriculture Service). These same crop years were used in the southern hemisphere analysis. Northern hemisphere regions are the Caribbean, Central America, East Asia, European Union, Former Soviet Union 12, Middle East, North Africa, North America, Other Europe, South Asia, and Southeast Asia. To focus the discussion, only regions accounting for 3% or more of northern hemisphere production of a given crop are reported individually.
Distribution of Production
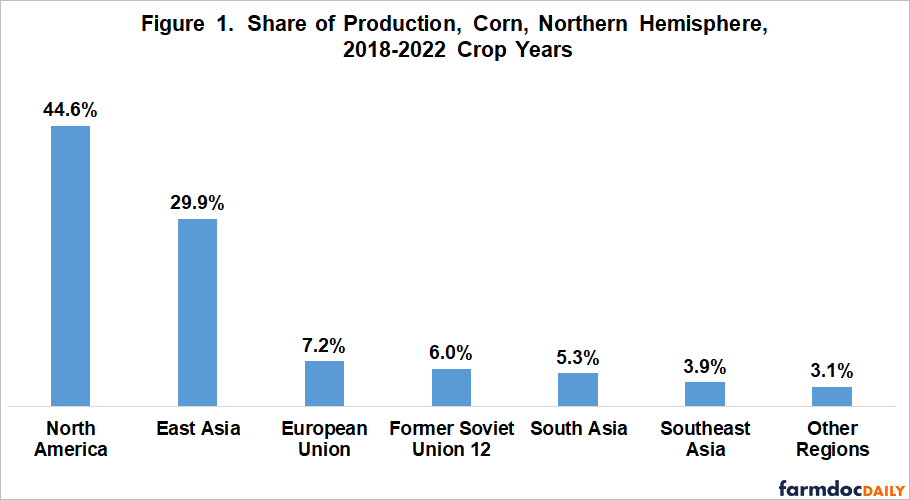
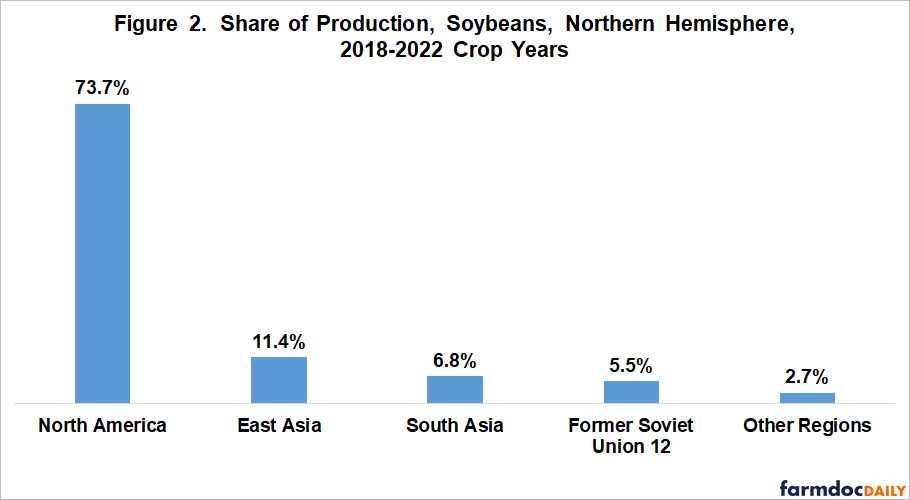
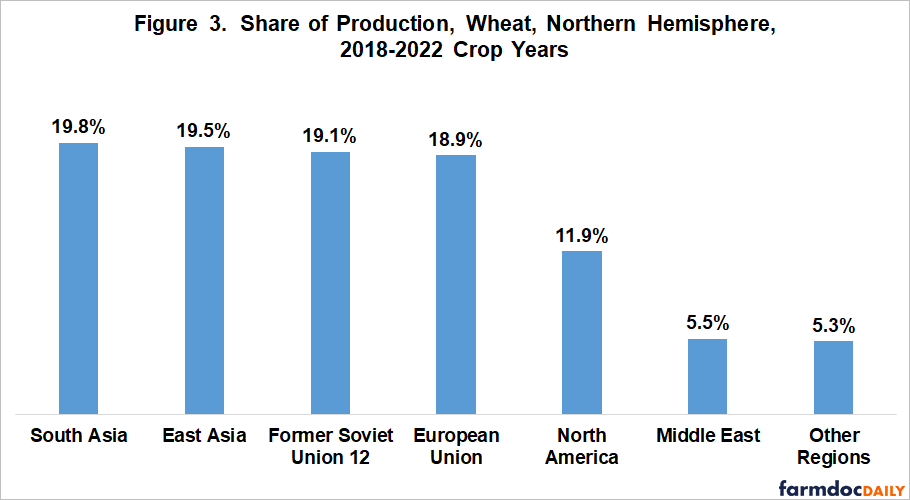
During the 2018-2022 crop years, the northern hemisphere accounted for 88%, 45%, and 91% of world corn, soybean, and wheat production, respectively. During these five years, North America accounted for 45% of northern hemisphere corn production (see Figure 1) and 74% of northern hemisphere soybean production (see Figure 2). East Asia was the second largest northern hemisphere corn and soybean producer but it was more important for corn than soybean production (30% vs. 11% share). Northern hemisphere wheat production was less concentrated. South Asia, East Asia, Former Soviet Union 12, and European Union all had shares of 19% to 20% (see Figure 3). North America was fifth with a 12% share.
The US was the largest producer in North America, although Canada produced more than a-third of North American wheat. China and India produced the most in East Asia and South Asia, respectively. Largest producer in the Former Soviet Union 12 was Russia for wheat and Ukraine for corn. Russia produced slightly more soybeans than Ukraine. Corn production was dispersed across Southeast Asia, with Indonesia the largest producer. Turkey and Iran produced over 80% of wheat in the Middle East, with Turkey the leading producer.
Variability of Production
Because of the importance of the Former Soviet Union 12 in northern hemisphere production and its transition from a centrally planned economy to a more market driven economy after the demise of the Soviet Union, the analysis of deviations from trend production is limited to period from 2003 to 2022. Production of corn and wheat began to trend upward in the early 2000s as agriculture recovered from its post-Soviet Union contraction.
Within sample trend production is estimated for each year for the regions listed in Figures 1-3. The estimated trendline production equations are in the Data Note. Trend production of corn for East Asia, Southeast Asia, and South Asia have curvilinear time trends. Corn production increased at an increasing rate in South Asia but increased at a declining rate in East and Southeast Asia. Trend corn production in the European Union, Former Soviet Union 12, North America, and northern hemisphere increased at a constant linear rate. Low explanatory power of the European Union corn equation reflects only a slight upward trend. Trend production of soybeans increased at a constant linear rate in the Former Soviet Union 12, North American, South Asia, and northern hemisphere. Soybean production in East Asia declined, then began to increase after 2010. Both East Asia and northern hemisphere trend production of wheat increased at a slightly decreasing rate. No trend exists for North America wheat production while Middle East wheat production had no trend to a slight decline. Trend wheat production increased at a constant linear rate for South Asia and the Former Soviet Union 12. Trend production of wheat has declined in the European Union since 2015.
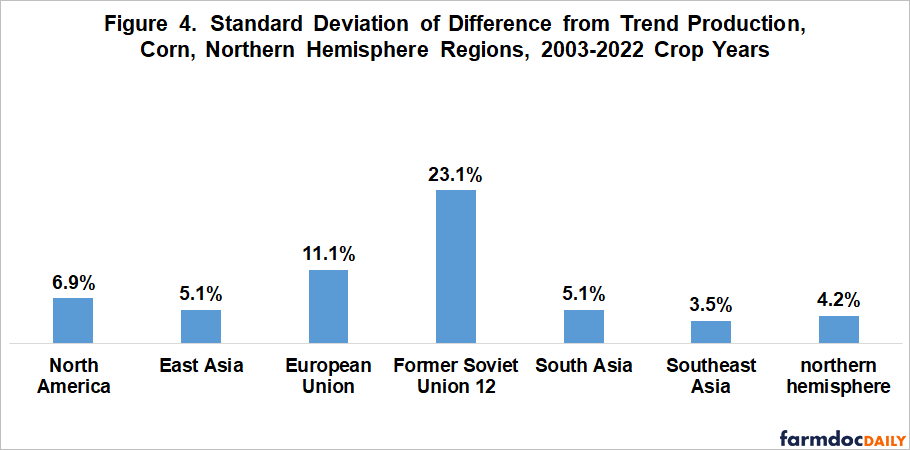
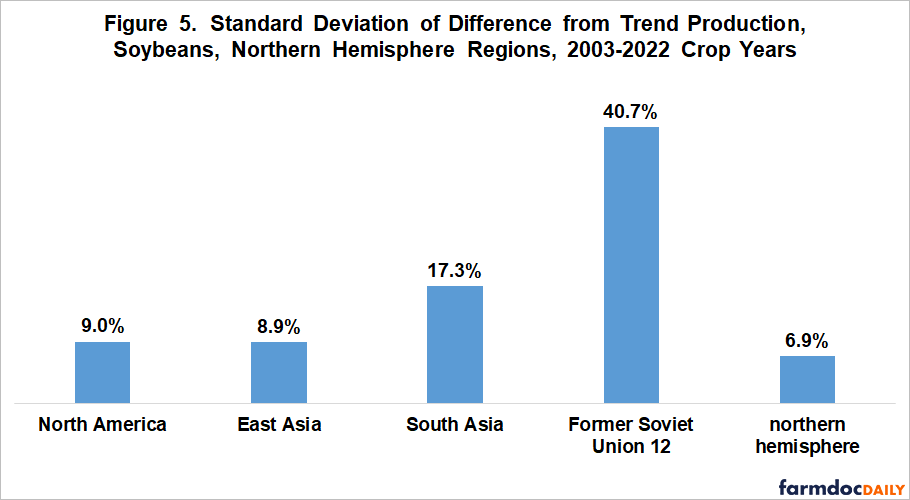
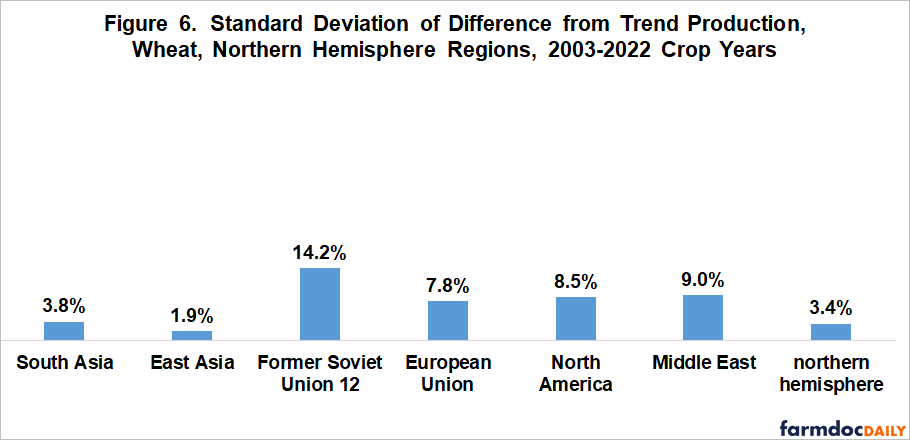
Production variability, as measured by standard deviation of annual percent variation of production from trendline, are mostly single digits (see Figures 4-6). Exceptions are corn, soybean, and wheat production in the Former Soviet Union 12 (23%, 41%, and 14%, respectively); corn production in the European Union (11%); and soybean production in South Asia (17%). The Former Soviet Union 12 clearly stands out.
Relationship between Production Deviations
For the northern hemisphere as a whole, production variability since 2002 is 4% for corn, 7% for soybeans, and 3% for wheat. For comparison, the comparable variability for the southern hemisphere is 6% for corn, 7% for soybeans, and 12% for wheat. Production variability was lower in the northern hemisphere for corn and especially wheat.
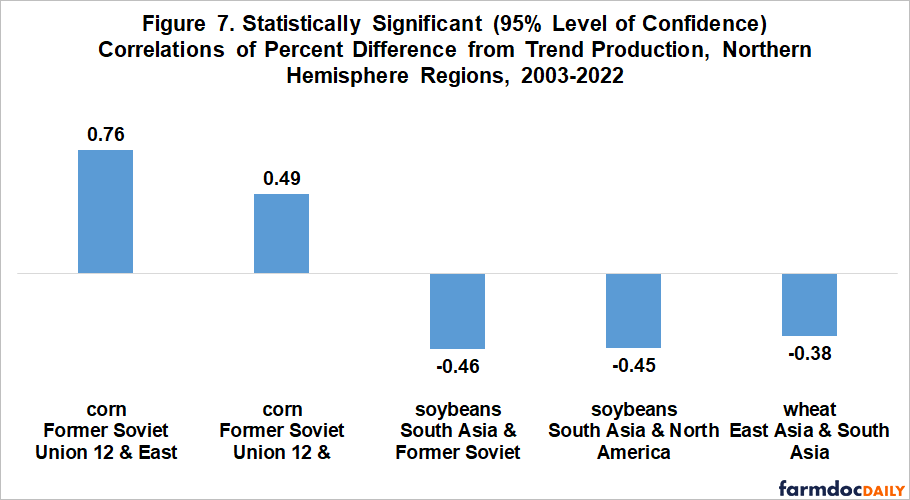
Production variability for the northern hemisphere is near the low end of the range of production variability of individual regions for a given crop (see Figures 4-6). A reason is the low correlation that existed for production deviations among the regions (see Figure 7). Of the 36 correlations calculated for the pairs of regions with at least 3% of northern hemisphere production of a given crop, only 5 differed significantly from zero with 95% statistical confidence. Three were negative. Negative and zero correlations dampen correlation for the broader group (i.e. northern hemisphere in this analysis).
The two statistically significant positive correlations involve the Former Soviet Union 12 and corn (see Figure 7). One is with East Asia; the other is with the European Union. A positive correlation indicates that, when one region was above (below) trend; the other region also had a tendency to be above (below) trend. Positive correlations can increase variability for the broader category.
Discussion
Overall, northern hemisphere production variability of corn, soybeans, and wheat is limited.
A key reason is the lack of correlation for deviations from trend production among the various northern hemisphere regions.
The preceding is especially important for corn and wheat because the northern hemisphere accounts for approximately 90% of world production.
Among northern hemisphere regions, production variability is highest in the Former Soviet Union. It is thus important to pay attention to corn, soybean, and wheat production in the Former Soviet Union, especially in the largest production counties of Russia and Ukraine.
Data Note – Estimated Trend Production Equations:
(units are million metric tons; time is a count variable starting with 1 for 2003/02)
| corn East Asia | = 90,559 + 17,705 (time) – 419 (time squared); R2 = 97% |
| corn European Union | = 58,517 + 351 (time); R2 = 9% |
| corn Former Soviet Union 12 | = 5,983 + 2,695 (time); R2 = 88% |
| corn North America | = 302,913 + 5,975 (time); R2 =69% |
| corn South Asia | = 17,887 + 822 (time) + 47 (time squared); R2 = 98% |
| corn Southeast Asia | = 18,602 + 1,342 (time) – 24 (time squared); R2 = 96% |
| corn northern hemisphere | = 492,853 + 35,546 (time) -697 (time squared); R2 = 94% |
| soybeans East Asia | = 18,672 – 975 (time) +52 (time squared); R2 = 61% |
| soybeans Former Soviet Union 12 | = -732 + 541 (time); R2 = 95% |
| soybeans North America | = 72,642 + 2,807 (time); R2 =78% |
| soybeans South Asia | = 7,345 + 209 (time); R2 = 40% |
| soybeans northern hemisphere | = 96,568 + 3,769 (time); R2 = 86% |
| wheat East Asia | = 84,885 + 5,402 (time) – 139 (time squared); R2 = 98% |
| wheat European Union | = 120,329 + 3,898 (time) – 173 (time squared); R2 = 21% |
| wheat Former Soviet Union 12 | = 73,222 + 3,466 (time); R2 = 73% |
| wheat Middle East | = 40,841 -151 (time); R2 = 8% |
| wheat North America | = 89,071 -183 (time); R2 =2% |
| wheat South Asia | = 90,182 +2,726 (time); R2 = 92% |
| wheat northern hemisphere | = 507,414 + 17,891 (time) -386 (time squared); R2 = 90% |
Data Sources and References
US Department of Agriculture, Foreign Agriculture Service. August 2023. Production, Supply, and Distribution Online. https://apps.fas.usda.gov/psdonline/
Zulauf, C., J. Colussi, G. Schnitkey and N. Paulson,. “Comparing Variability of Southern and Northern Hemisphere Production of Corn, Soybeans, and Wheat.” farmdoc daily (13):141, Department of Agricultural and Consumer Economics, University of Illinois at Urbana-Champaign, July 31, 2023.
Disclaimer: We request all readers, electronic media and others follow our citation guidelines when re-posting articles from farmdoc daily. Guidelines are available here. The farmdoc daily website falls under University of Illinois copyright and intellectual property rights. For a detailed statement, please see the University of Illinois Copyright Information and Policies here.