


Another Strong Year for Ethanol Production Profits in 2023
The U.S. ethanol industry entered 2023 on an uncertain note, with weekly profits teetering around the breakeven level. Like all other facets of the commodity business, the ethanol industry was rocked by the market impacts of the Ukraine-Russia War for much of 2022. In this extremely volatile environment, it was far from clear how the U.S. ethanol industry would fare going into 2023. The purpose of this article is to estimate the profitability of U.S. ethanol production for the 2023 calendar year and assess how successfully the industry navigated the continuing volatility in commodity markets.
Ethanol Plant Model
A model of a representative Iowa ethanol plant is used to track the profitability of ethanol production. It is the same basic model of a representative ethanol plant that has been used in previous farmdoc daily articles on the subject (e.g., January 27, 2021; February 10, 2022; March 22, 2023) The original version of the model was developed by Don Hofstrand of Iowa State University and was meant to be representative of a typical ethanol plant constructed in the mid-2000s. There is certainly substantial variation in capacity and production efficiency across the industry and this should be kept in mind when viewing profit estimates based on the model.
Some of the original assumptions of the model have been changed based on additional analysis or changing data availability. Current model assumptions include:
- Dry mill plant constructed in 2007
- 100 million gallon annual ethanol production capacity
- Plant construction costs of $2.11 per gallon of ethanol production capacity
- 40% debt and 60% equity financing
- 8.25% interest on 10-year loan for debt financing, with the loan fully repaid in 2017
- A total of $0.21 fixed costs per gallon of ethanol produced through 2017 and $0.15 per gallon in 2018-2023 (the decline is due to the loan payoff)
- Non-corn, non-natural gas variable costs (including denaturant) of $0.21-$0.26 per gallon in 2007-2011
- Non-corn, non-natural gas variable costs (excluding denaturant) of $0.17 -$0.22 per gallon after 2011
- Variable denaturant costs after 2011 computed as 2 percent of the wholesale CBOB price
- 82.5 cubic feet of natural gas per bushel of corn processed
- Netback (marketing) costs of $0.05 – $0.07 per gallon of ethanol and $4-$6 per ton of DDGS
- Extraction and marketing costs of $0.05 – $0.07 per pound of corn oil
Operating efficiency assumptions represent a key component of the model. These have been revised substantially over time as new data has become available. The latest assumptions are based on analysis of the operating efficiency of the U.S. ethanol industry in a recent farmdoc daily article (February 9, 2024). Specifically, the current assumptions for physical conversion rates are as follows:
- 2.75 gallons of ethanol (including denaturant) produced per bushel of corn processed over 2007-2011; 2.80 gallons of ethanol per bushel of corn over 2012-2014; 2.85 gallons of ethanol per bushel of corn over 2015-2018; 2.90 gallons of ethanol per bushel of corn over 2019-2022; and 2.95 of ethanol per bushel of corn in 2023
- 17.75 pounds of DDGS produced per bushel of corn processed over 2007-2011; 17.00 pounds of DDGS per bushel of corn for 2012-2016; 16.50 pounds of DDGS per bushel of corn over 2017-2018; 16.00 pounds of DDGS per bushel of corn in 2019; 15.75 pounds of DDGS per bushel in 2020-2021; 16.00 pounds of DDGS per bushel in 2022; and 15.50 pounds per bushel in 2023
- 0.55 pounds of corn oil per bushel of corn processed over 2012-2014 (start extracting January 2012); 0.60 pounds of corn oil per bushel of corn processed in 2015; 0.70 pounds of corn oil per bushel of corn processed in 2016; 0.75 pounds of corn oil per bushel of corn processed in 2017-2019; 0.80 pounds of corn oil per bushel of corn processed in 2020; 0.85 pounds of corn oil per bushel of corn processed in 2021; and 0.90 pounds of corn oil per bushel of corn processed in 2022-2023.
To track plant profitability over time, weekly corn, ethanol, and DDGS prices at Iowa ethanol plants are collected from the USDA Agricultural Marketing Service starting in late January 2007. Crude corn oil prices for the Midwest are available from OPIS. Natural gas costs over 2007 through March 2014 are based on monthly industrial prices for Iowa available from the EIA. Due to a change in the behavior of the industrial price series, starting in April 2014 natural gas costs are based on monthly electric power consumer prices for Iowa, also from the EIA.
Analysis
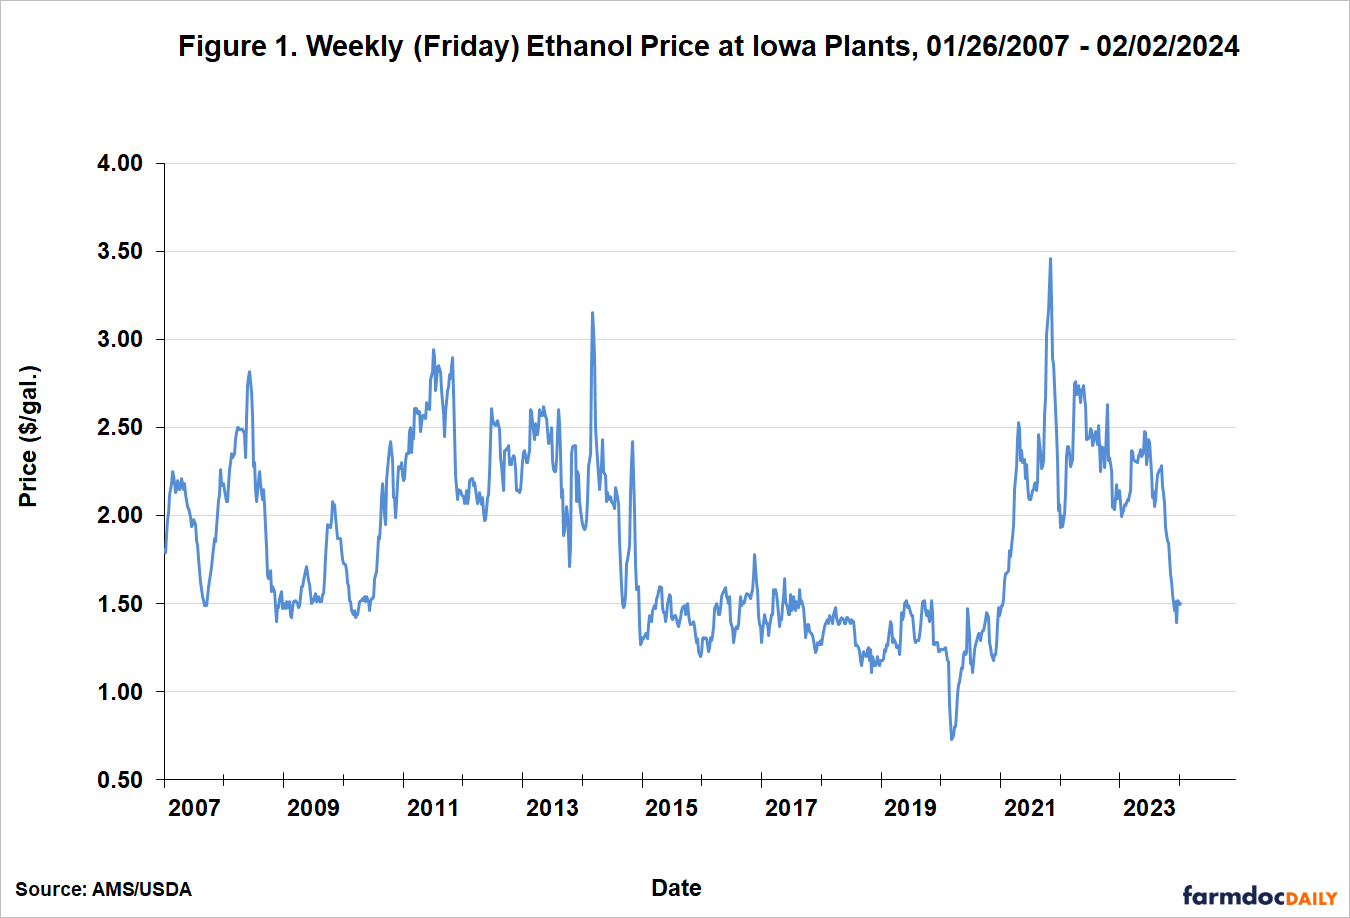
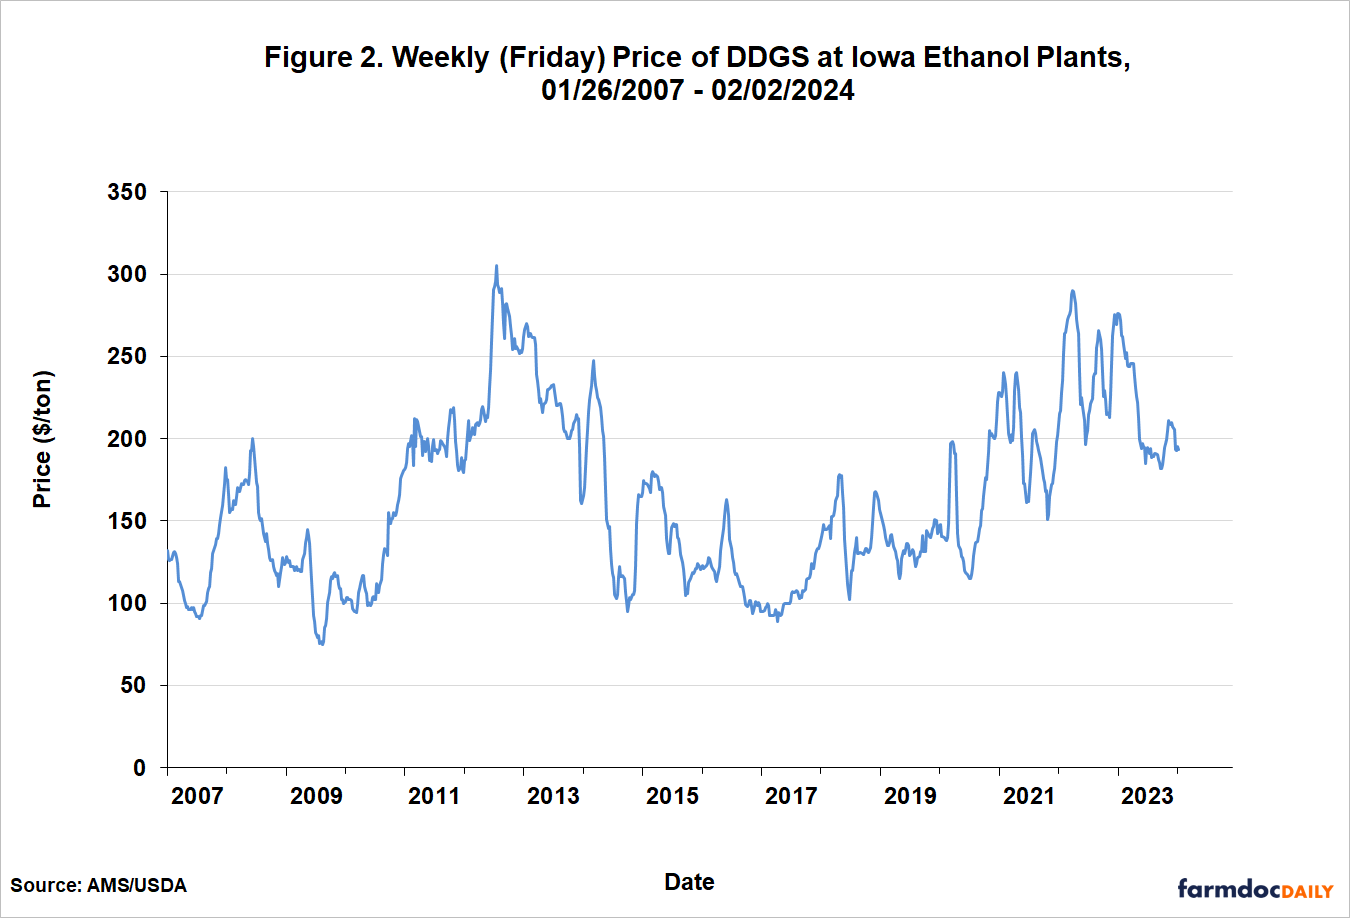
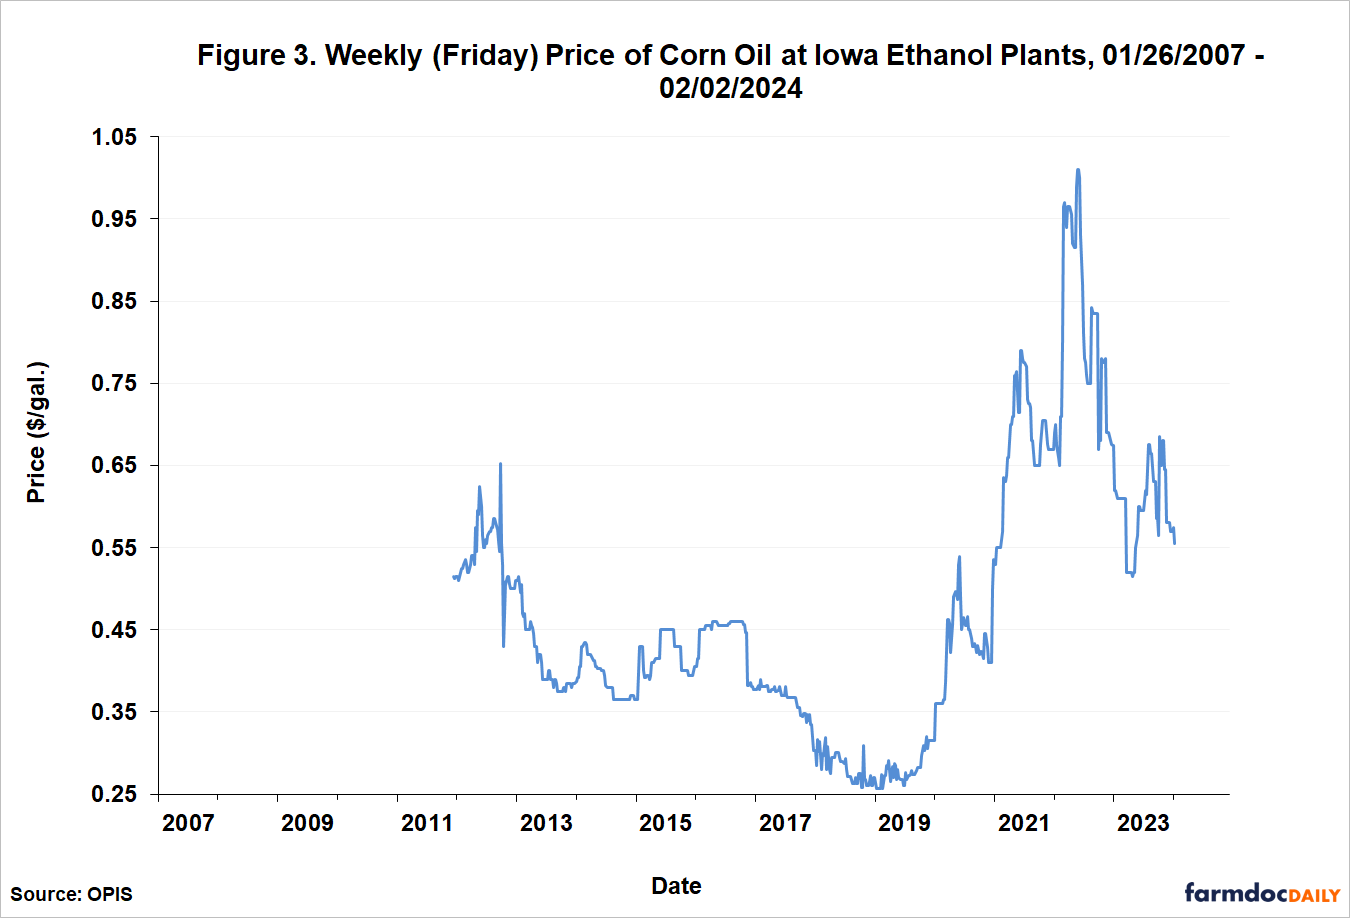
Figures 1, 2, and 3 present the three components of ethanol production revenue on a weekly basis from January 26, 2007 through February 2, 2024. Figure 1 shows the weekly price of ethanol at Iowa plants. The figure reveals that prices for the first three quarters of 2023, while down substantially compared the all-time high in November 2021 of $2.46 per gallon, moved in a similar wide trading range as in 2022. Then starting in October 2023 prices moved sharply lower, ending up near $1.50. In comparison, Figure 2 shows that weekly DDGS prices moved in a trading range for the entirety of 2023 that was also similar to 2022. Figure 3 shows that that weekly corn oil prices during 2023 moved in a fairly narrow range between roughly $0.55 and $0.65 per gallon. These prices were substantially lower than the levels experienced in 2022, when corn oil prices exploded to an all-time high of $1.01 per pound. In general, output prices for ethanol producers remained volatile in 2023.
The main input cost of producing ethanol is corn (about 80 percent). Figure 4 shows that the price of corn spiked in 2022 after the outbreak of the war in Ukraine and remained historically high early in 2023, reaching as high as $7 per bushel early in the year. Prices then went on an extended decline through the remainder of the year, ending up under $5 per bushel. In total, corn prices declined over $2 per bushel during 2023.
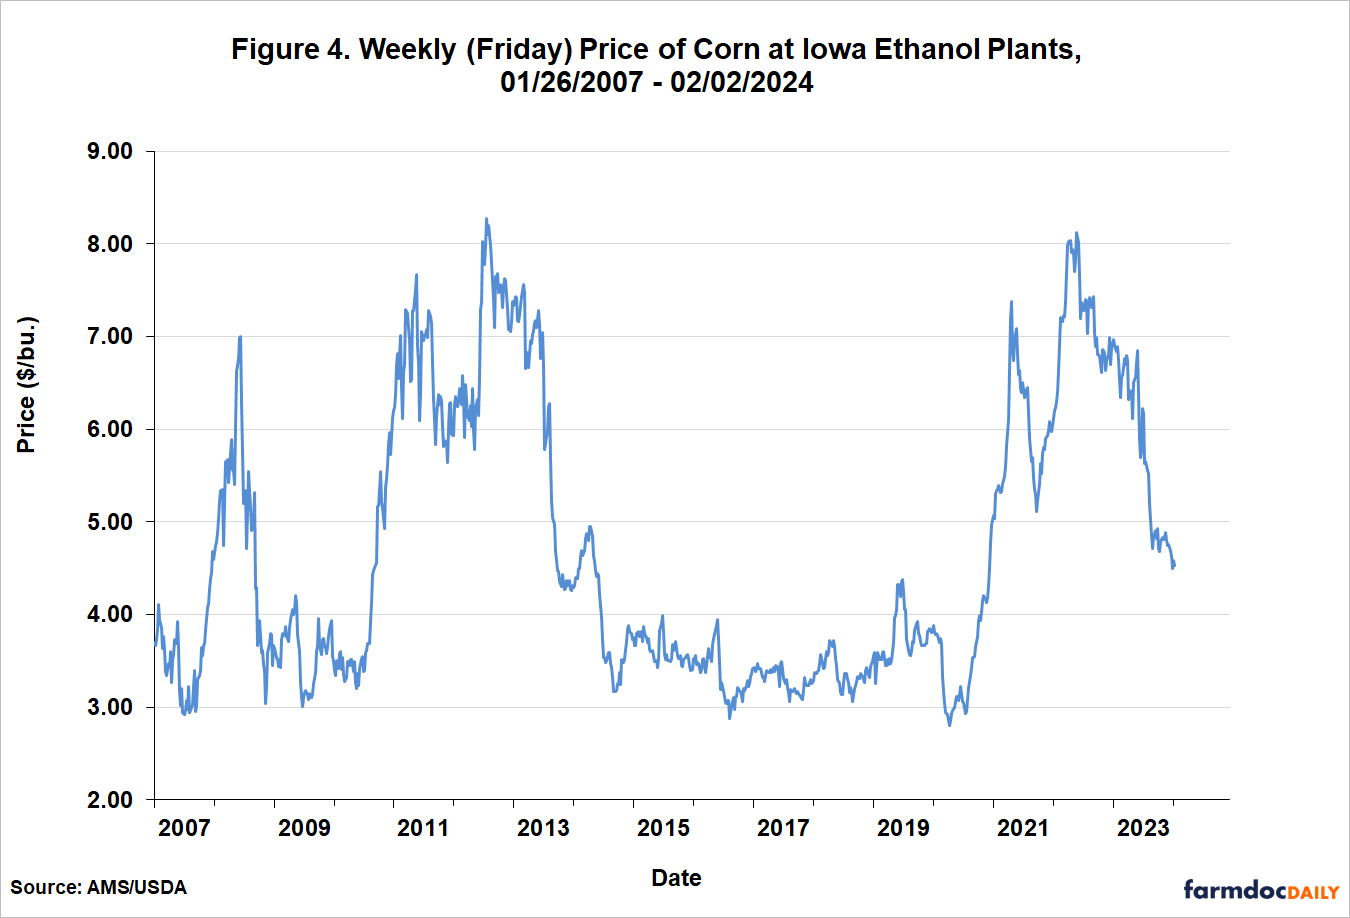
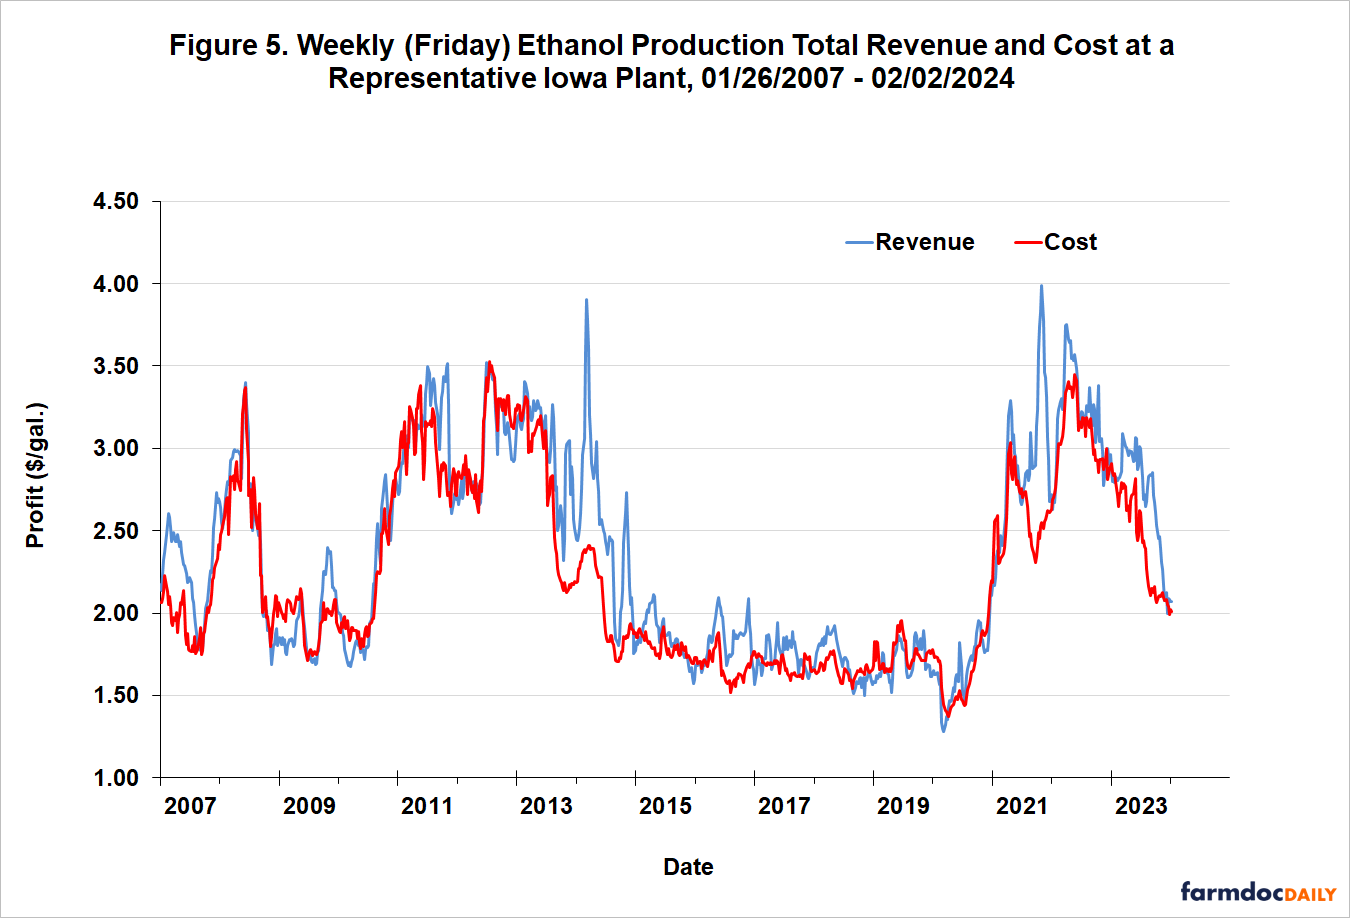
Figure 5 presents combined weekly total revenue for ethanol, DDGS, and corn oil and weekly total variable and fixed costs for the representative Iowa plant. Revenue began 2023 near $3.00 per gallon, but led by declining ethanol prices, sunk to nearly $2 per gallon by the end of the year. Despite the declining trajectory of revenue within the year, revenue exceeded total costs all but a few weeks in 2023.
Weekly ethanol production profit net of all variable and fixed costs is shown in Figure 6. This is simply the difference between revenue and cost presented in Figure 5. Net profits ranged widely in 2023, from a low of -$0.05 to a high of $0.74 per gallon, which is not surprising given the volatility of both output (ethanol, DDGs, corn oil) and input (corn) prices. After reaching the high for the year in October, net profits declined rapidly and ended up the year near breakeven. Despite the late year swoon, net profits for 2023 averaged $0.29 per gallon, more than twice the historical average since 2007. Hence, 2023 turned out to be a strong year for ethanol profits.
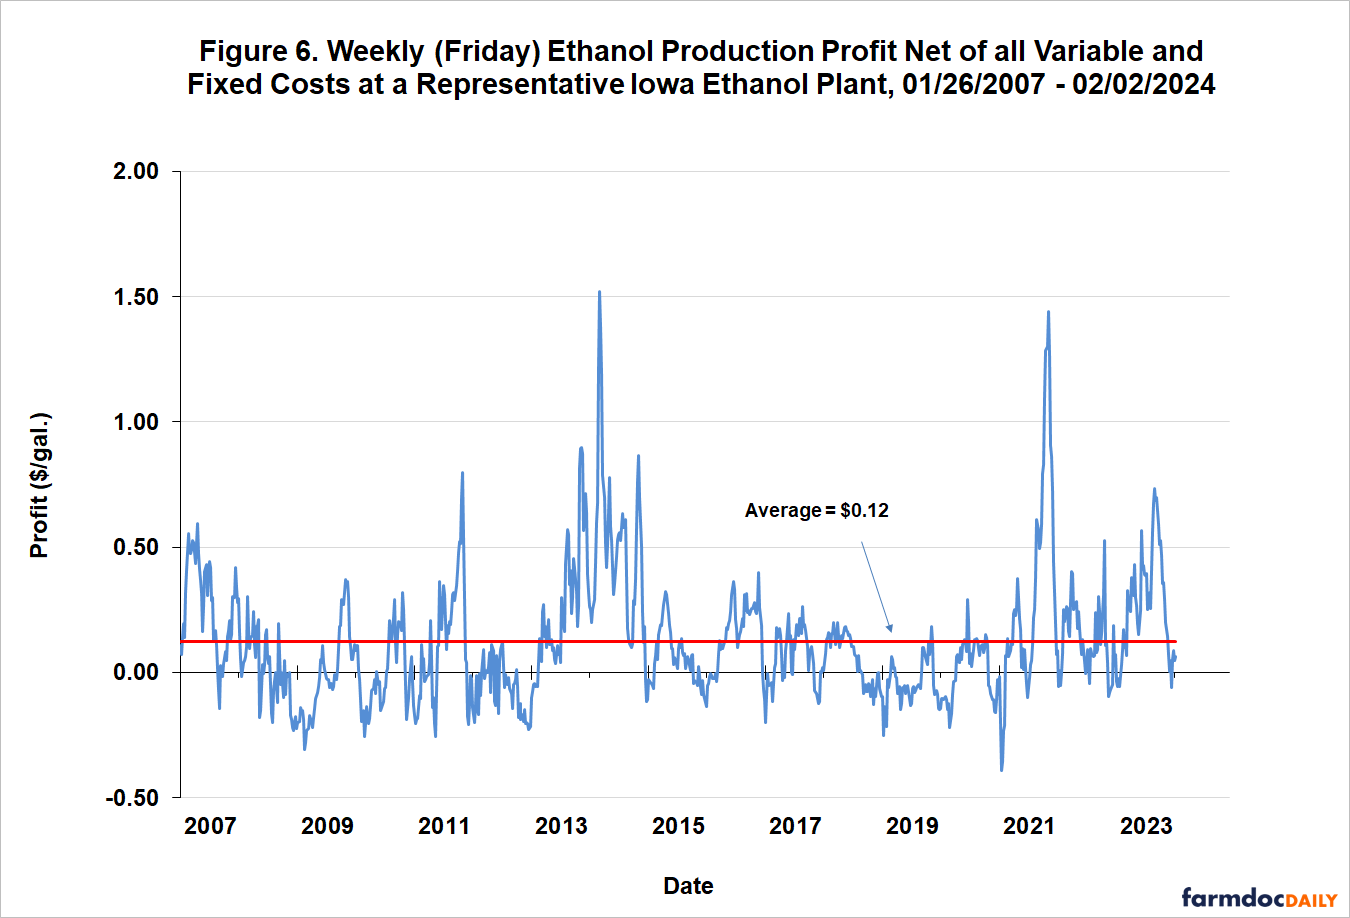
The timing of declines in corn and ethanol prices is key to understanding why ethanol profits were so strong in 2023. Examination of Figures 1 and 4 shows that corn prices declined throughout 2023 while ethanol prices held steady until the final three months of the year. This lag in the adjustment of ethanol prices to the decline in corn prices was enough to spur profitability for most of the year.
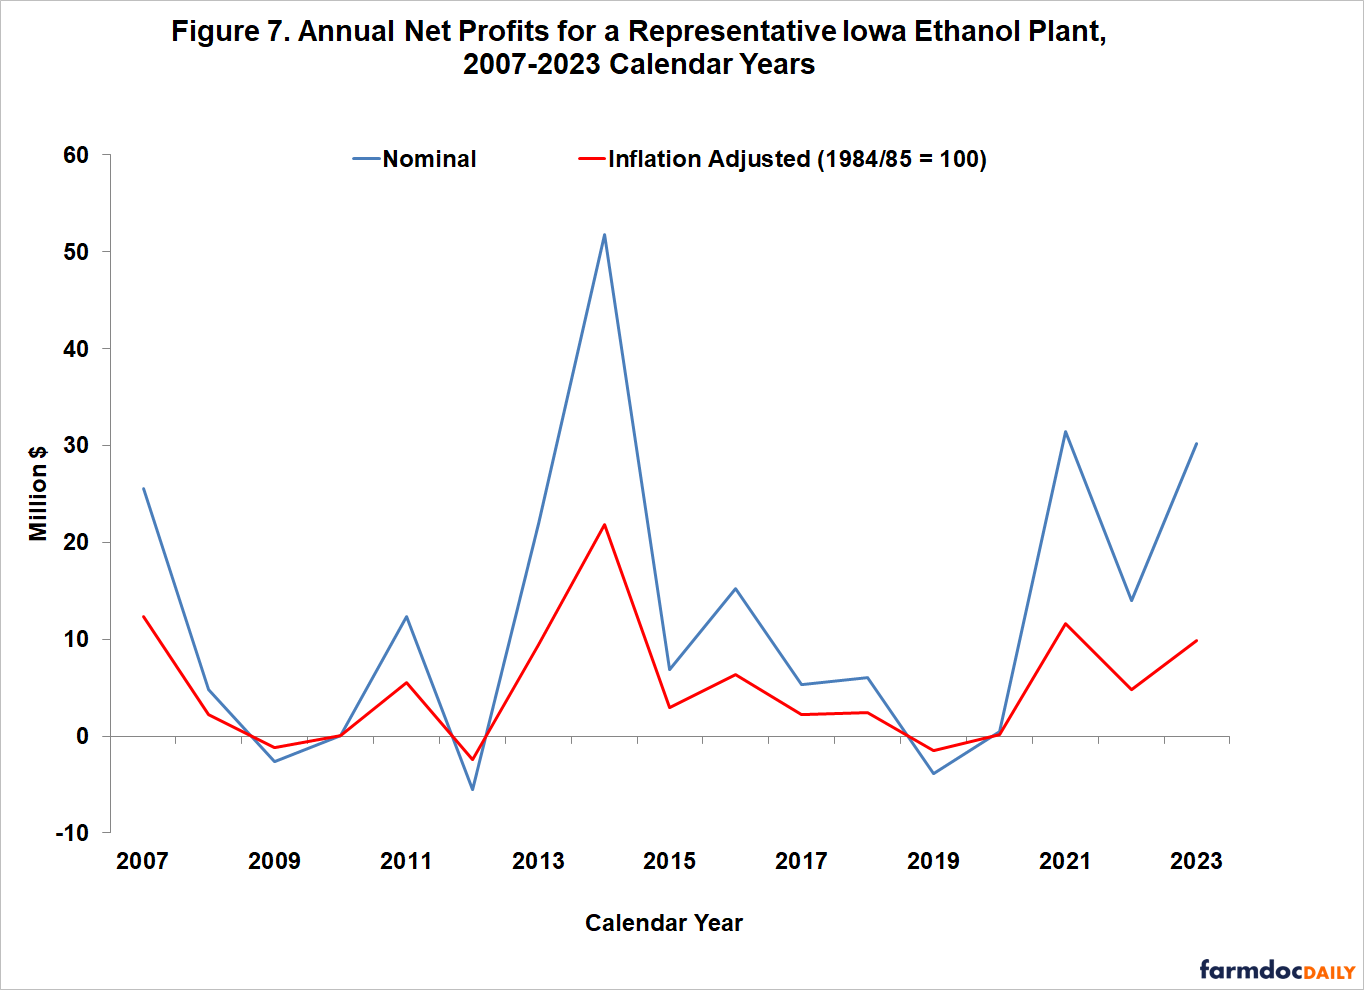
It is also useful to consider ethanol production profitability aggregated over an annual horizon for 2007 through 2023, as shown in Figure 7. Annual profits are presented in both nominal and inflation adjusted (real) terms. The nominal net profit of $30.2 million in 2023 was the third highest since 2007. It was also the fourth straight year of positive profits. There has only been one year with negative returns since 2013. Given the burst of inflation the last several years, the real level of profits in 2023 is not quite as impressive. Real profits in 2023 were the fourth highest since 2007.
Finally, we can use the average net profit for the representative plant to make a rough estimate of profit for the entire U.S. ethanol industry in 2023. Assuming all operating plants in the industry earned the average net profit for the representative plant of $0.29 per gallon and that total ethanol production for the U.S. was 15.5 billion gallons in 2023, total (pre-tax) profit for all operating ethanol plants can be estimated at $4.5 billion. Again, indicative of a strong year for ethanol producers.
Implications
The war in Ukraine took center stage in 2022 and it led to extraordinary volatility in nearly all commodity prices, and this continued into 2023. Ethanol producers in the U.S. managed to weather the price shocks reasonably well in 2023, with average profits for the year of $0.29 per gallon, more than twice the long-term average of $0.12. Ethanol producers in particular benefited in 2023 from a lag in the adjustment of ethanol prices to declining corn prices. In nominal dollar terms, the net profit for a representative ethanol plant was $30.2 million in 2023, the third highest since 2007. In sum, 2023 turned out to be a strong year for ethanol profits.
References
Irwin, S. "Trends in the Operational Efficiency of the U.S. Ethanol Industry: 2023 Update." farmdoc daily (14):28, Department of Agricultural and Consumer Economics, University of Illinois at Urbana-Champaign, February 9, 2024.
Irwin, S. "A Solid Year for Ethanol Production Profits in 2022." farmdoc daily (13):52, Department of Agricultural and Consumer Economics, University of Illinois at Urbana-Champaign, March 22, 2023.
Irwin, S. "Ethanol Production Profits in 2021: What a Ride!" farmdoc daily (12):18, Department of Agricultural and Consumer Economics, University of Illinois at Urbana-Champaign, February 10, 2022.
Irwin, S. "Ethanol Production Profits in 2020: A Year Like No Other." farmdoc daily (11):13, Department of Agricultural and Consumer Economics, University of Illinois at Urbana-Champaign, January 27, 2021.
Disclaimer: We request all readers, electronic media and others follow our citation guidelines when re-posting articles from farmdoc daily. Guidelines are available here. The farmdoc daily website falls under University of Illinois copyright and intellectual property rights. For a detailed statement, please see the University of Illinois Copyright Information and Policies here.