


Farm Bill 2024: Reviewing A February Data Blitz and Tough Realities
In the shadow of Super Bowl LVIII, USDA released a virtual blitz of data. These include the 2022 Census of Agriculture and a new data visualization tool for the Inflation Reduction Act investments in conservation assistance to farmers, which followed the recent release of updated farm income statistics. Notably, the Census news included concerns about a decrease in the number of farmers (lowest since 1850) and a loss of farmland in America (USDA-NASS, 2022 Census; Farm Policy News, February 14, 2024; USDA-ERS, February 7, 2024; USDA-NRCS, Inflation Reduction Act Data Visualization Tool; Abbott, February 13, 2024). The Congressional Budget Office (CBO) also got in on the data blitz, releasing an update to its ten-year budget baseline projections (Swagel, CBO, February 7, 2024; CBO USDA Mandatory Farm Programs, February 7, 2024). The 2024 farm bill reauthorization debate, however, has yet to get started (Downs and Lee, February 12, 2024; Thompson, February 9, 2024). This article reviews some of the data with a view towards implications for the 2024 farm bill reauthorization debate.
Background
The Congressional Budget Office (CBO) recently updated its forecasts for the major mandatory Farm Bill programs; the updated projections, however, are not expected to be the baseline projections that the agriculture committees in Congress will work under if they move forward with reauthorization in 2024. Compared to the May 2023 baseline, CBO projects $62.5 billion less spending with a $7.7 billion decrease (88.4% of May 2023) for the commodities programs in Title I, and a $2 billion decrease (96.5% of May 2023) for conservation programs. The only increase is the projection for crop insurance, which jumped $22.7 billion over 10 years (122.4%) compared to the May 2023 baseline.
The bulk of reduced spending projections is due to lower projections for the Supplemental Nutrition Assistance Program (SNAP) in the Nutrition Title. CBO projects a $74.4 billion (93.8% of the May 2023 baseline) decrease. Typically overlooked or purposefully ignored, SNAP spending is driven by participation. Participation in the program results from a very difficult reality in America: the sheer number of Americans who fall below poverty measures. In 2024, CBO projects 41.1 million Americans will receive SNAP benefits on average each month, down from the 2023 projection of 42.2 million people; the average monthly benefit they would receive is a mere $204 per participant, or less than $2,500 per year. For context, the individual payment limit for farm program payments is 50 times that amount ($125,000 per year), while a farmer with peanut base acres receives a separate limit for those base acres of $125,000. Context matters; in 2019, for example, $6.2 billion was paid to 2.1 million farms by ARC/PLC, while 35.7 million people received SNAP benefits totaling $55.6 billion. In other words, 17 times the number of people (than farms) received just under 9 times the amount of benefits. A focus on the topline in the baseline too often appears to be a strategy of convenient avoidance about the basic realities of the people on the other end of the policies.
The February 2024 update also includes a separate projection for the additional investments in four conservation programs included in the Inflation Reduction Act of 2022: Environmental Quality Incentives Program (EQIP), Conservation Stewardship Program (CSP), Agricultural Conservation Easement Program (ACEP), and the Regional Conservation Partnership Program (RCPP). Overall, CBO is projecting a slightly higher (103.7%) amount in total outlays in the February update as compared to the May 2023 baseline, with projected outlays increasing from $15.99 billion to $16.2 billion for fiscal years 2024 to 2031. Notably, CBO is now assuming that USDA will spend more of the IRA appropriations, especially in the last few years they are available (FY2029-FY2031), but CBO’s projections remain below the total appropriation of $18 billion; a scoring projection outcome that does not actually limit USDA’s ability to get the assistance to farmers.
For a better view of the results in FY2023 for IRA conservation funding, the new NRCS data tool provides state-by-state breakdowns (USDA-NRCS, Inflation Reduction Act Data Visualization Tool). USDA reports that 99.91% of the total allocation for FY2023 was obligated to farmers, serving a reminder that all funds could reach farmers for conservation without regard to CBO projections for the spending. Figure 1 provides an additional interactive map for the Conservation Stewardship Program (CSP) and Environmental Quality Incentives Program (EQIP) FY2023 funding as reported.
Discussion
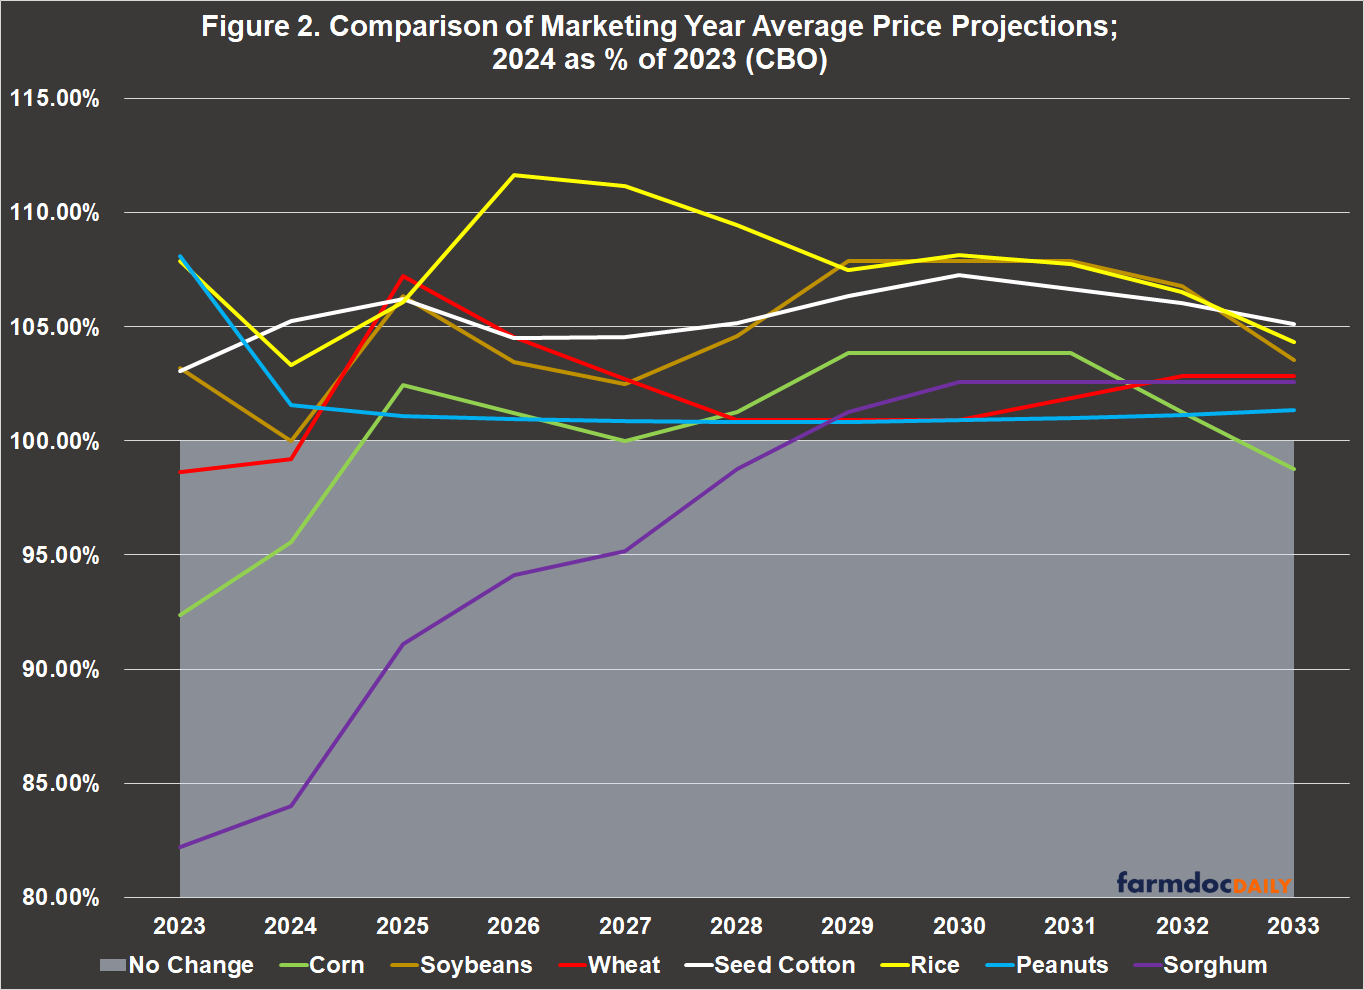
CBO’s February update included revised projections for the Marketing Year Average (MYA) prices. Overall, CBO’s revised projections are lower for some crops (corn, wheat, and sorghum) and higher for other crops (soybeans, seed cotton, rice, and peanuts) than it did in May 2023. Figure 2 illustrates the comparison with each crop’s MYA projection in the February 2024 update as a percent of that crop’s projection in the May 2023 baseline.
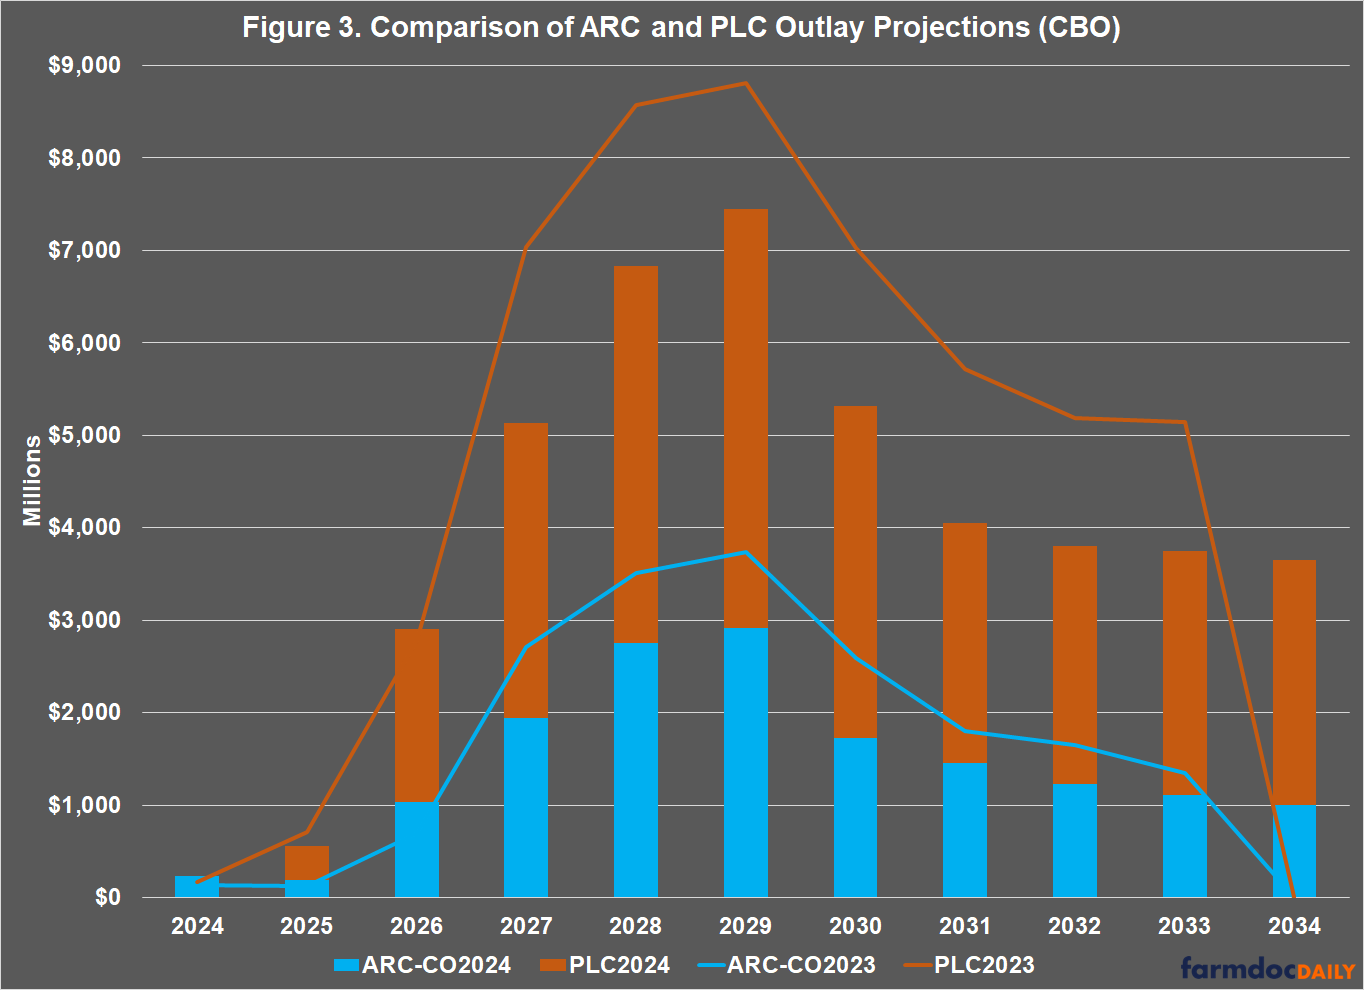
The higher price projections impact CBO’s projected spending or outlays for Price Loss Coverage (PLC) and the Agriculture Risk Coverage (ARC) farm payment programs. Figure 3 illustrates the difference by comparing the February 2024 update (bars) for each program with the May 2023 baseline (lines) for each program; note, that the update includes fiscal year 2034, which was not in the May 2023 baseline causing the lines to drop off in that year. Overall, CBO’s ten-year projected cost for ARC-CO has decreased by $2.9 billion in February compared to May 2023; the projected cost for PLC has dropped $4.8 billion.
CBO’s updated projections also contribute perspectives for the impasse over farm policy, which has been largely due to a yet-unknown demand to increase reference prices. To date, no concrete proposal has been put forward with specifics for which crops and what level of increases to reference prices. Complicating the matter further are the automatic increases under the 2018 program design (see e.g., farmdoc daily, October 5, 2023). Possible further strategic avoidance, Figure 4 highlights one of the political problems with increasing reference prices. Figure 4 illustrates the average PLC payment per payment acre (85% of base acres assumed to enroll in PLC) as projected by CBO in the February 2024 update (see also, farmdoc daily, May 18, 2023).
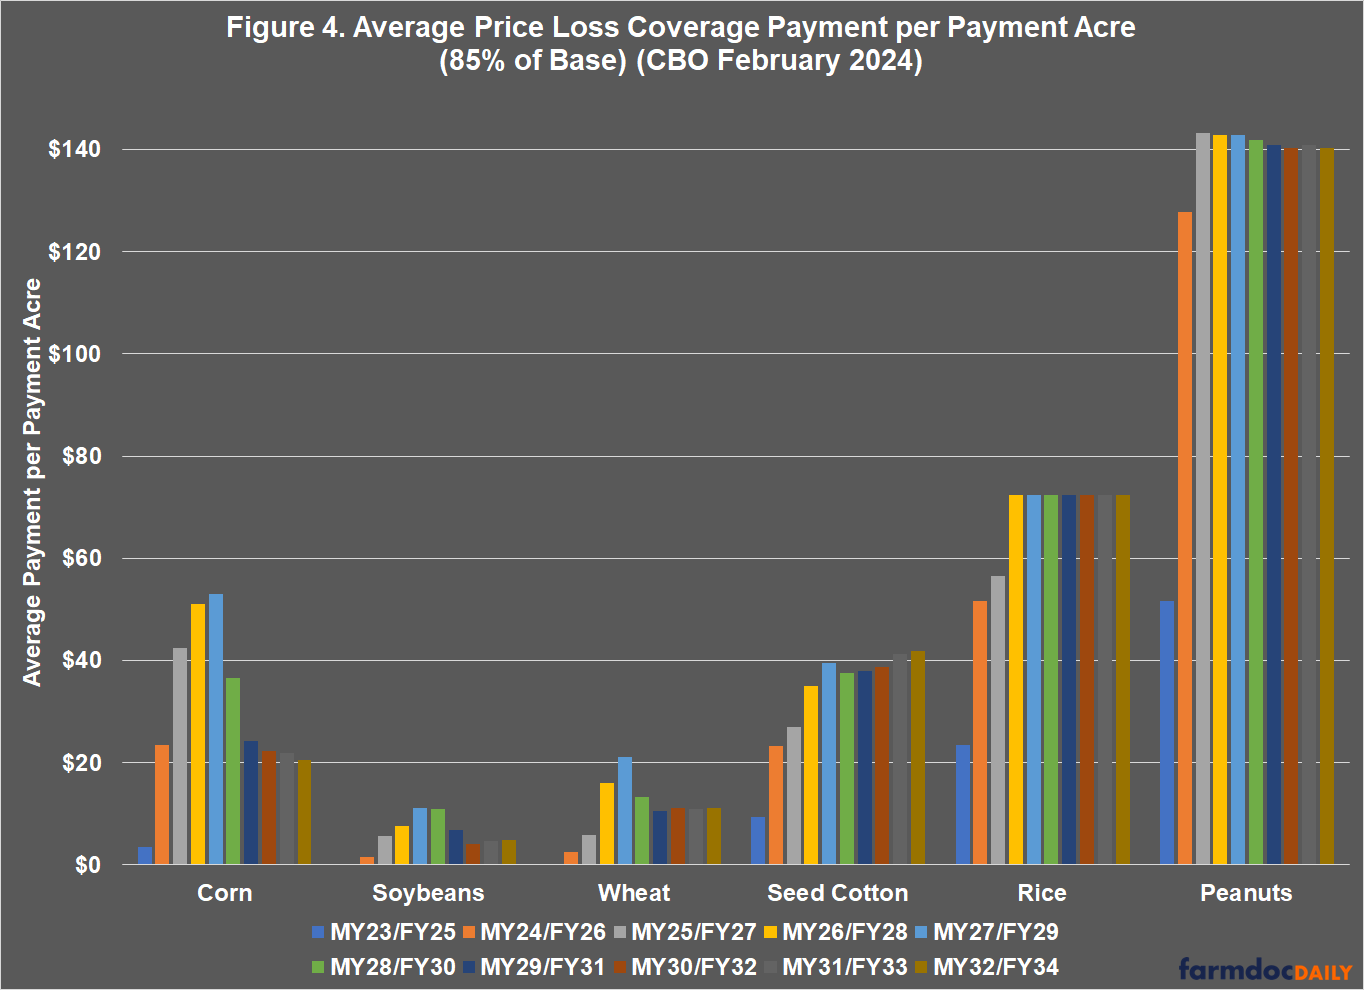
The imbalance in favor of peanuts (4,919 total farms (not farmers) in the 2022 Census) and rice (3,824 total farms (not farmers) in the 2022 Census) is critical if raising reference prices makes the imbalance worse. It also begs questions about Congressional policy decisions and priorities. If doing so requires cutting conservation assistance for all farmers, moreover, those matters magnify because increasing reference prices will require offsets. Using the IRA funds as an offset requires taking away funds that are available to farmers for conservation and using them to cover the projected costs in the CBO scoring process. In short, this takes money from farmers to “pay-for” the economic modeling projections. While this entire matter is confusing and obscure, the following is an initial attempt at understanding this significant problem.
Figure 5 begins by comparing current effective reference prices (lines) with the threshold for payment (area). For any PLC payment on any base acre, the MYA must fall below the effective reference price threshold, represented in Figure 5 as the area below 100%. The relationship between MYA and effective reference price for each of the major program crops in each marketing year (MY) is presented as a percentage and illustrated by the lines in Figure 5. Where MYA is more than 100% (most years for most of the crops) of the effective reference price in a marketing year the situation would result in no actual payment triggered. The offset problem for IRA is illustrated by the stacked bars, which are reported on a fiscal year (FY) basis and have been aligned with the relevant marketing year in Figure 5. The stacked bars are the CBO spending or outlay projections for each major program crop and fiscal year. Note the level of projected spending (outlays) in fiscal years associated with MYA price projections above the threshold. In those year scenarios, no actual payments would be made on base acres for those crops at those MYA levels but CBO projects substantial costs.
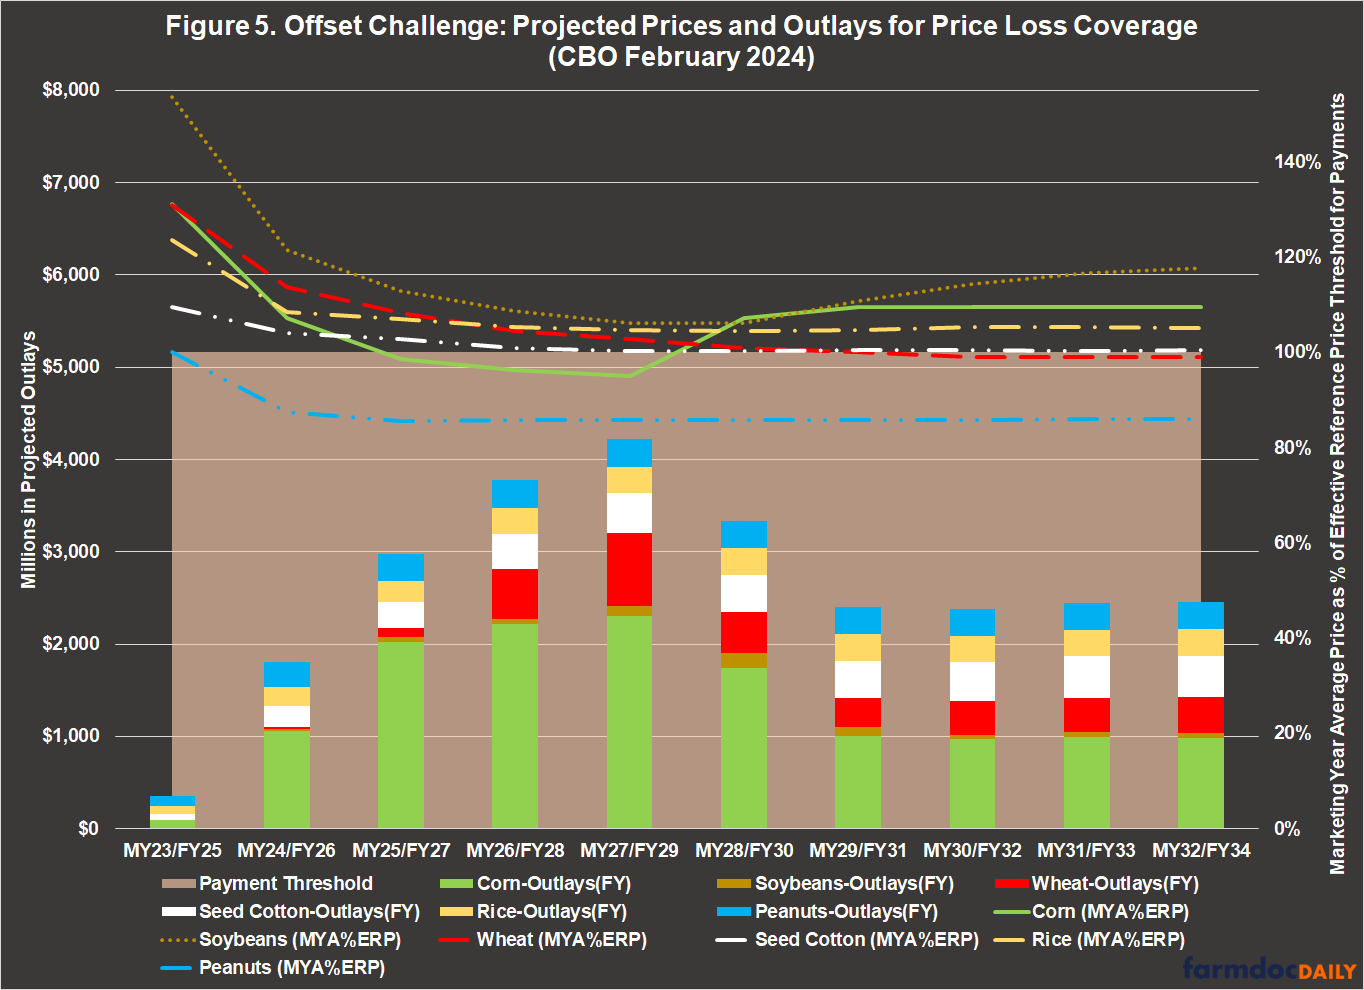
In total, 65% of the PLC spending projected by CBO is for years in which the MYA price projection is above the threshold and would not trigger payments. The projected outlays must be offset, not actual payments; the offset must be covered in advance, before there is any knowledge about future crop prices, and cannot be recovered if actual payments are not triggered. If IRA conservation investments and/or SNAP assistance are used to cover the projected costs for increasing reference prices, therefore, it is very likely that a substantial share of those dollars will be lost to the scoring dynamics—the funds will pay for modeling results not investments in farm conservation or assisting low-income families. This, of course, makes the imbalance among program crops more significant and problematic.
Concluding Thoughts
Farm Bill reauthorization has failed to launch; it is the hidden demand for increasing reference prices, not matched by any actual proposals and shielded from public scrutiny, that blocks any potential for progress. A virtual blitz of data recently released by USDA and CBO sheds further light. The updated CBO projections indicate over $70 billion less in spending for the Supplemental Nutrition Assistance Program (SNAP). CBO also projects lower spending for farm payment programs and conservation, but increased spending for crop insurance. For farm payment programs and crop insurance, the revised projections are likely both due to projections for higher program crop prices. The vast imbalance among farmers with base acres in different commodities, as reinforced in the latest CBO projections, continues to beg questions while also offering clues about the missing proposal for increasing reference prices (and maybe some part of the focus on SNAP).
A few clues do not provide justification, however. Public policies expend public resources and present statements by elected officials about priorities. If raising reference prices requires cutting conservation and SNAP assistance as an offset, there is much that needs to be justified. Taking away funds is problematic because those funds are highly likely to be lost—CBO’s updated projections indicate that 65% of current projected costs are for years in which the MYA price projections would not trigger payments. Offsetting projected outlays in the CBO model is not the same as making payments to farmers; the tradeoff in an offset is not matched dollar-for-dollar in actual assistance received by farmers or low-income families, especially because an offset must be given in advance and cannot be recovered if payments are not triggered. Using Inflation Reduction Act conservation investments to cover these projected costs is very likely to result in a substantial share of those dollars being lost to the score, paying for modeled outcomes not investments in farmers or conservation. The same problems apply to using SNAP reductions as an offset but are magnified by the realities of harming those struggling to put food on the table. These realities cannot be ignored if a farm bill is to have any chance.
References
Abbott, Chuck. “Smallest number of U.S. farms since 1850, says ag census.” Thefern.org. February 13, 2024. https://thefern.org/ag_insider/smallest-number-of-u-s-farms-since-1850-says-ag-census/.
Congressional Budget Office. “Details About Baseline Projections for Selected Programs.” February 2024. https://www.cbo.gov/data/baseline-projections-selected-programs#25.
Coppess, J. "Farm Bill 2023: Don’t Look Now, but Reference Prices Will Increase." farmdoc daily (13):182, Department of Agricultural and Consumer Economics, University of Illinois at Urbana-Champaign, October 5, 2023.
Coppess, J. "Budget Policy, the Updated CBO Baseline & the Debt Limit." farmdoc daily (13):91, Department of Agricultural and Consumer Economics, University of Illinois at Urbana-Champaign, May 18, 2023.
Downs, Garrett and Meredith Lee Hill. “Inside the escalating funding and farm bill battles.” Politico.com. February 12, 2024. https://www.politico.com/newsletters/weekly-agriculture/2024/02/12/inside-the-escalating-funding-and-farm-bill-battles-00140884.
Swagel, Phill. “Director’s Statement on the Budget and Economic Outlook for 2024 to 2034.” Congressional Budget Office. February 7, 2024. https://www.cbo.gov/publication/59933.
Thompson, Glenn. “Opinion: It’s time to get serious about revitalizing rural America.” Agri-Pulse.com. February 9, 2024. https://www.agri-pulse.com/articles/20623-opinion-rural-america-needs-a-farm-bill-its-time-to-get-serious.
Disclaimer: We request all readers, electronic media and others follow our citation guidelines when re-posting articles from farmdoc daily. Guidelines are available here. The farmdoc daily website falls under University of Illinois copyright and intellectual property rights. For a detailed statement, please see the University of Illinois Copyright Information and Policies here.