


The Curious Case of US Corn Yields in 2023
Despite concerns over dry weather and drought conditions in June of 2023, the US produced a record corn crop of more than 15.3 billion bushels. However, average corn yield performance varied considerably across the US in 2023. Many counties achieved good to excellent yields relative to trend estimates, but other counties had yields well below trend.
Herein, we report recently released yields from the National Agricultural Statistics Service (NASS) of the USDA. NASS yields are not used in calculating payments from county-based insurance products or the Agriculture Risk Coverage at the county level (ARC-CO) program. However, NASS yields are highly correlated with the yields from RMA (Risk Management Agency) and FSA (Farm Service Agency) that will determine payments. NASS county yields suggest payments from area-based insurance, including the SCO (Supplemental Coverage Option) and ECO (Enhanced Coverage Option) programs, are likely for a number of counties for the 2023 corn crop. ARC-CO may trigger payments in a limited number of counties whose yields were significantly below trend.
2023 County Corn Yields
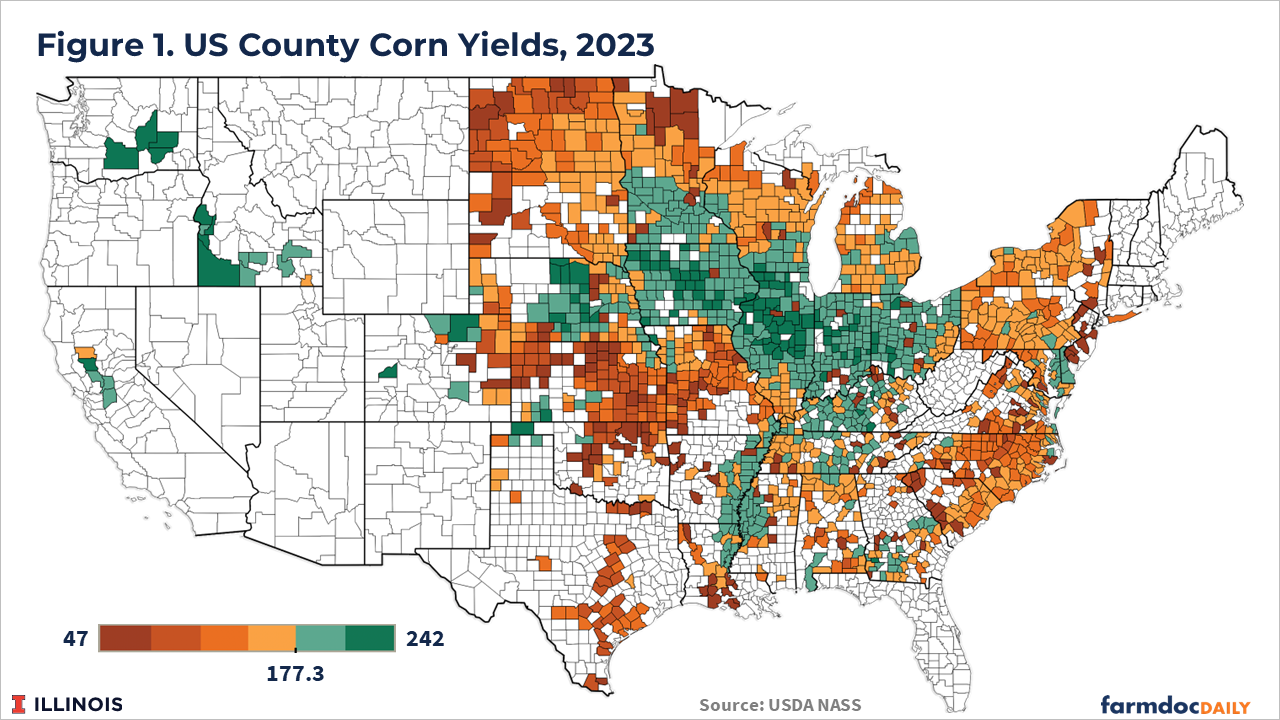
NASS, an agency of the U.S. Department of Agriculture, recently released their survey-based county yield estimates for 2023 (see Figure 1). Counties in the green categories had 2023 yields above the national average of 177.3 bushels per acre. Counties in orange had yields below the national average. Yields above the national average were concentrated across the main Corn Belt region (central Nebraska, southern Minnesota, Iowa, the northern two-thirds of Illinois, southern Wisconsin, Indiana, and Ohio). The pattern of higher yields in these more highly productive regions is typical across years.
Historical NASS yield data at the national, state, and county levels from 1993 to 2022 was used to estimate 2023 trend yields – yields that would be achieved under normal growing conditions – by fitting a simple linear regression trendline. Only counties with at least 15 years of historical yield data over the 30-year period used to fit the trend are included in the comparison of actual 2023 yields to trend estimates. We do note that use of differing historical periods can lead to variation in trend yield estimates.
Figure 2 reports average corn yields relative to trend for the top 13 corn producing states which accounted for 88% of total US corn production in 2023. Five states achieved corn yields which exceeded trend estimates. Indiana’s average corn yield in 2023 (203 bu/acre) was 8.5% above trend (187.2 bu/acre). The average yields in Ohio, Kentucky, Illinois and North Dakota were also above trend in 2023. The remaining 8 states had below trend yields. The average corn yield in Kansas (119 bu/acre) was 8% below trend, while the yields in Minnesota and Missouri were slightly more than 6% below trend. The average US corn yield of 177.3 bushels per acre in 2023 was 3.4 bushels per acre (1.9%) shy of the 180.7 bushel per acre US trend yield.
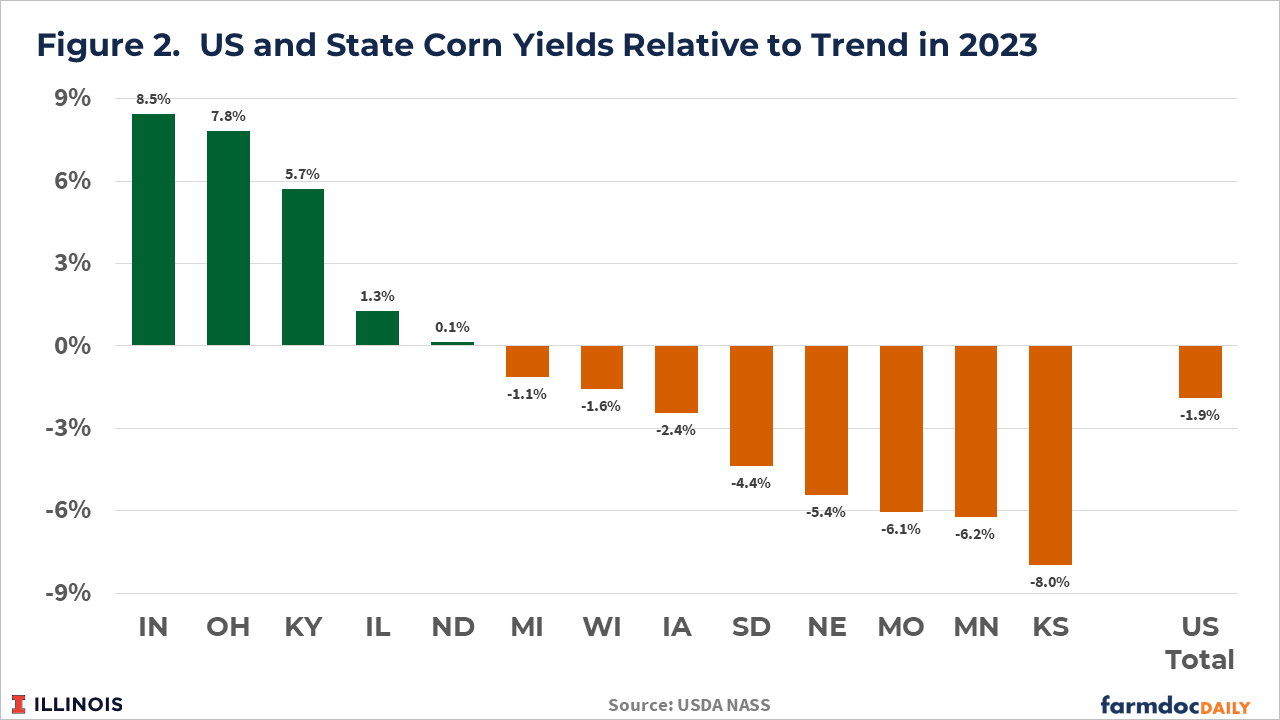
Figure 3 illustrates county-level yields relative to trend in 2023. Counties with above trend yield are depicted with green categories while counties with below trend yields are in orange categories. The majority of counties in Indiana and Ohio – states with the largest yields relative to trend – had corn yields above trend. Similarly, counties in Kansas, Missouri, and Minnesota – states with corn yields more than 6% below trend – experienced some of the largest negative deviations from trend yields.
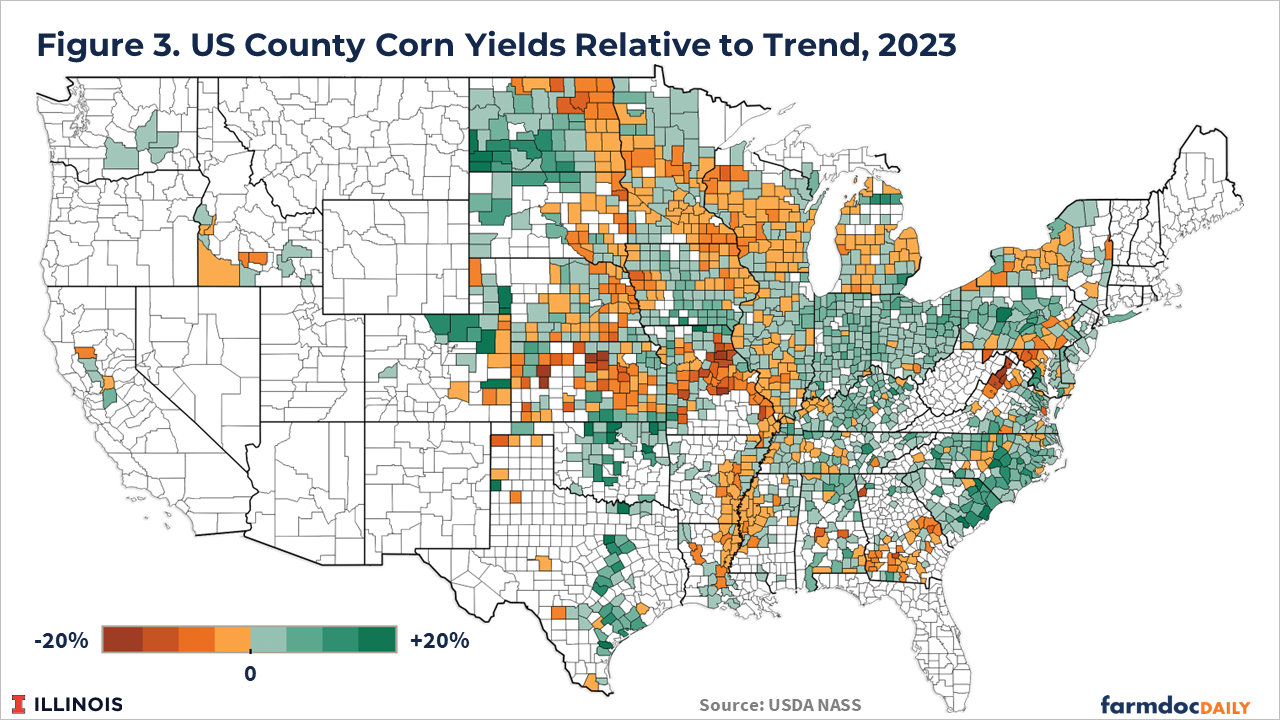
Figure 4 shows Illinois county corn yields (left panel) and county yields relative to trend (right panel) for 2023. The average corn yield for Illinois was 206 bushels per acre, 2.6 bushels per acre above the 2023 trend estimate of 203.4 bushels per acre. Yields above the statewide average occurred in the majority of counties in the northern two-thirds of Illinois. The highest reported yield for 2023 was 234 bushels per acre in Stark County in northcentral Illinois.
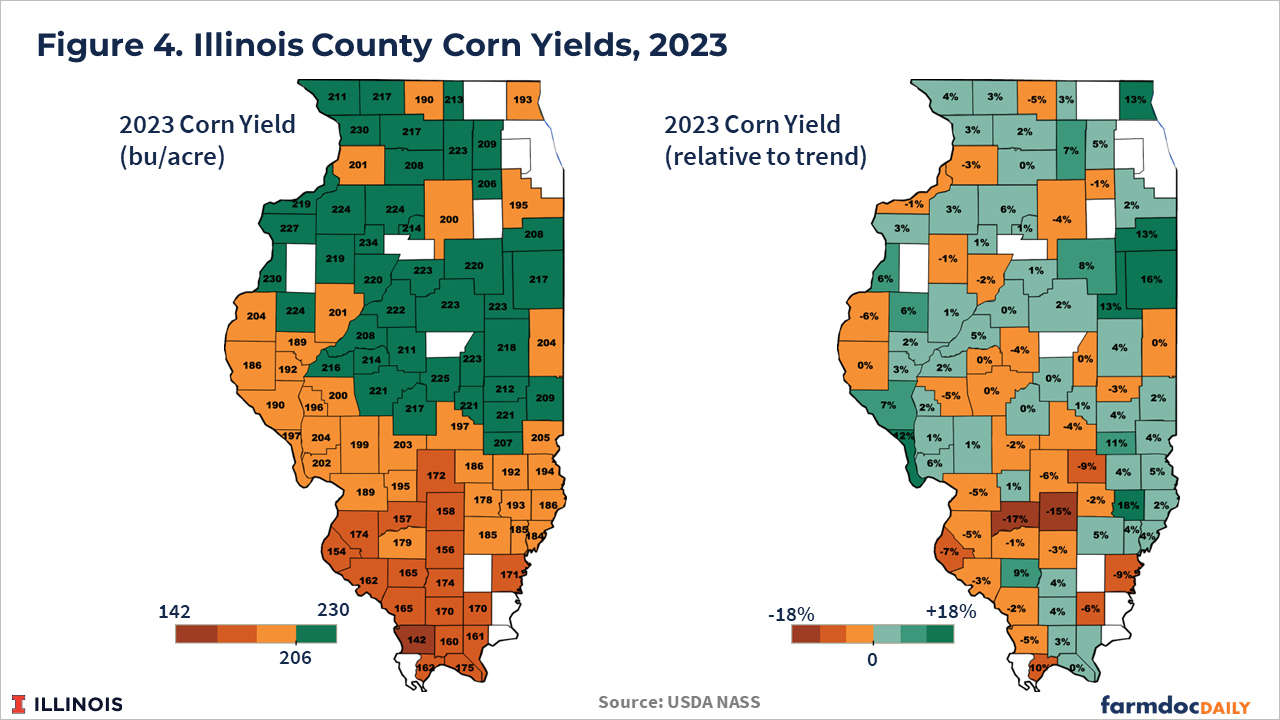
Yields below the statewide average occurred mainly in the southern portion of Illinois, reflecting the lower productivity soils in that region. The lowest reported yield for 2023 was 142 bushels per acres in Union County in southern Illinois.
Yield performance relative to trend yield was more variable across the state. Yields were 18% above trend in Richland County in southeastern Illinois. Yields were 12% above trend in Calhoun County in western Illinois, and more than 12% above trend in a pocket of counties in the northeastern region of Illinois (Lake, Kankakee, Iroquois, and Ford Counties). Yields were more than 15% below trend in Marion and Clinton Counties in southern Illinois.
Discussion
Widespread drought conditions in June of 2023 led to serious concerns over crop yield potential (see farmdoc daily from June 20, 2023). Drought conditions in 2023 peaked at the end of June, with 70% of corn producing areas considered to be in a drought as of June 27th. Five of the top corn producing states had 90% or more of their area classified in drought condition. Nebraska and Missouri had more than 25% of their area under extreme drought, while 18% of Kansas was in extreme drought. At the time, drought conditions across the Midwest generally exceeded those experienced at the same time in 2012, the most severe drought in terms of US crop yield impacts since the 1980s.
In contrast with 2012, when drought conditions continued to become more severe through the last half of the growing season, rainfall in July and August improved conditions throughout much of the major corn growing regions of the US in 2023. Anecdotal evidence from farmers during the 2023 harvest suggested wide yield variability but the consensus seemed to be that yield numbers were better than would have been expected given the dry weather through the first half of the growing season.
The NASS corn yield data for 2023 largely confirms the anecdotes from the harvest season. While many areas did see major yield reductions, likely associated with dry conditions, there were also areas with excellent yields.
Implications
While the NASS yields discussed here are not the yields that RMA will use to determine indemnity payments for area-based insurance plans or the yields that FSA will use to calculate ARC-CO payments, they do provide a useful guide.
Given the harvest insurance price ($4.88 per bushel) was 17% below the projected price ($5.91) for corn in 2023, large yield losses will not be required to trigger revenue insurance indemnities, particularly at higher coverage levels (see farmdoc daily from November 1, 2023). Based on the NASS county yields, payments from the supplemental and enhanced coverage option (SCO and ECO) plans will likely be triggered in many counties given their relatively high coverage levels (86% for SCO, as high as 95% for ECO).
Payments from ARC-CO will not be determined until the marketing year average price for 2023 is over in September, and FSA releases county-level yields to calculate payments. Still, as with the outlook for area-based crop insurance indemnities, the yield losses relative to trend based on the NASS county yield data suggest ARC-CO payments could be triggered for some counties for 2023. Given ARC-CO’s 86% revenue guarantee, the $3.98 ARC corn benchmark price, and USDA’s current forecast of $4.75 for the 2023 marketing year average corn price, a county’s actual yield would need to be 28% below the ARC-CO benchmark yield to trigger payments. Thus, payments from ARC-CO could occur but will likely be limited to counties with significant yield losses in 2023.
Summary
US corn yields in 2023 generally seemed to exceed expectations based on the significant drought conditions across the corn-growing regions in late June resulting in a record production level of 15.3 billions bushels. As is typical, corn yield outcomes varied across regions with some counties achieving above trend yields and others having yields below trend.
NASS yield data suggests yield losses were likely sufficient to trigger area-based insurance indemnities in a number of counties for 2023. ARC-CO payment may also be triggered in a limited number of US counties that experienced more extreme yield losses.
References
Paulson, N., G. Schnitkey and B. Sherrick. "2023 Harvest Prices and Revenue Insurance Payments for Corn and Soybeans." farmdoc daily (13):200, Department of Agricultural and Consumer Economics, University of Illinois at Urbana-Champaign, November 1, 2023.
Schnitkey, G., N. Paulson, C. Zulauf and J. Baltz. "Dry Weather and Drought in the Midwest, Middle-June 2023." farmdoc daily (13):112, Department of Agricultural and Consumer Economics, University of Illinois at Urbana-Champaign, June 20, 2023.
Disclaimer: We request all readers, electronic media and others follow our citation guidelines when re-posting articles from farmdoc daily. Guidelines are available here. The farmdoc daily website falls under University of Illinois copyright and intellectual property rights. For a detailed statement, please see the University of Illinois Copyright Information and Policies here.