Should We Have Been Surprised by the U.S. Average Yield of Corn in 2023?
The USDA released its “final” estimate of the U.S. average yield of corn for 2023 in the January Crop Production Annual Summary report. The estimate was 177.3 bushels per acre, 2.4 bushels higher than the November estimate. This “final” estimate may be revised at the end of the 2023/24 marketing year, but these revisions are usually quite small. The final U.S. average yield for corn for 2023 of 177.3 bushels was a new record, but it was only 3.4 bushels above the average for the previous seven years. From a purely historical perspective, the 2023 corn yield was not an outlier. However, many observers were quite surprised by the new record corn yield given weather conditions for the 2023 growing season (e.g., Hirtzer, 2023; farmdoc daily, March 19, 2024). Significant areas of the Corn Belt were classified as being in severe or extreme drought during parts of the growing season, especially during the first half of the season (see U.S. Drought: Weekly Report for June 27, 2023 for an example). Other observers argued that a shift to more favorable weather conditions in July and August was responsible for what seems like a surprisingly high U.S. average corn yield (CropProphet, 2024). The purpose of this article is to use a crop weather model of the U.S. average yield of corn to determine whether the 2023 yield was truly surprising given growing conditions. The crop weather model is an updated version of the one used in this earlier farmdoc daily article (October 9, 2023).
Analysis
We begin by reviewing the “Thompson-style” crop weather regression model that was used in the October 9th article to relate the U.S. average corn yield to a time trend, the percentage of the crop planted late, and an array of weather variables. The updated version of the model estimated here uses data from 1980 through 2023 and includes the following explanatory variables: i) a linear time trend variable to represent technological change, ii) the percentage of the corn crop planted late, iii) linear functions of preseason (September-March), April, and August precipitation, iv) quadratic functions of June and July precipitation, and v) linear functions of April, May, June, July, and August temperatures. The late planting variable is defined as the percentage of U.S. corn acreage planted after May 30th from 1980 through 1985 and after May 20th from 1986 onwards. While there are certainly many other specifications that could be considered, the model explains 98 percent of the variability in the U.S. average yield of corn, and therefore captures the most important factors that drive yield at this level of aggregation. Complete details on the model specification can be found in the October 9th article.
The monthly weather data are collected for 10 key corn-producing states (Iowa, Illinois, Indiana, Minnesota, Missouri, Nebraska, North Dakota, Ohio, South Dakota, and Wisconsin). These 10 states typically accounted for about 75-80 percent of total U.S harvested acreage of corn during the sample period. An aggregate measure for the 10 states was constructed using harvested corn acres to weight state-specific observations. The weighted-average monthly weather variables are used to represent weather observations for the entire U.S. corn crop. Precipitation data are monthly totals and temperature data are monthly averages. The National Weather Service is the source for the weather data via the Midwest Regional Climate Center.
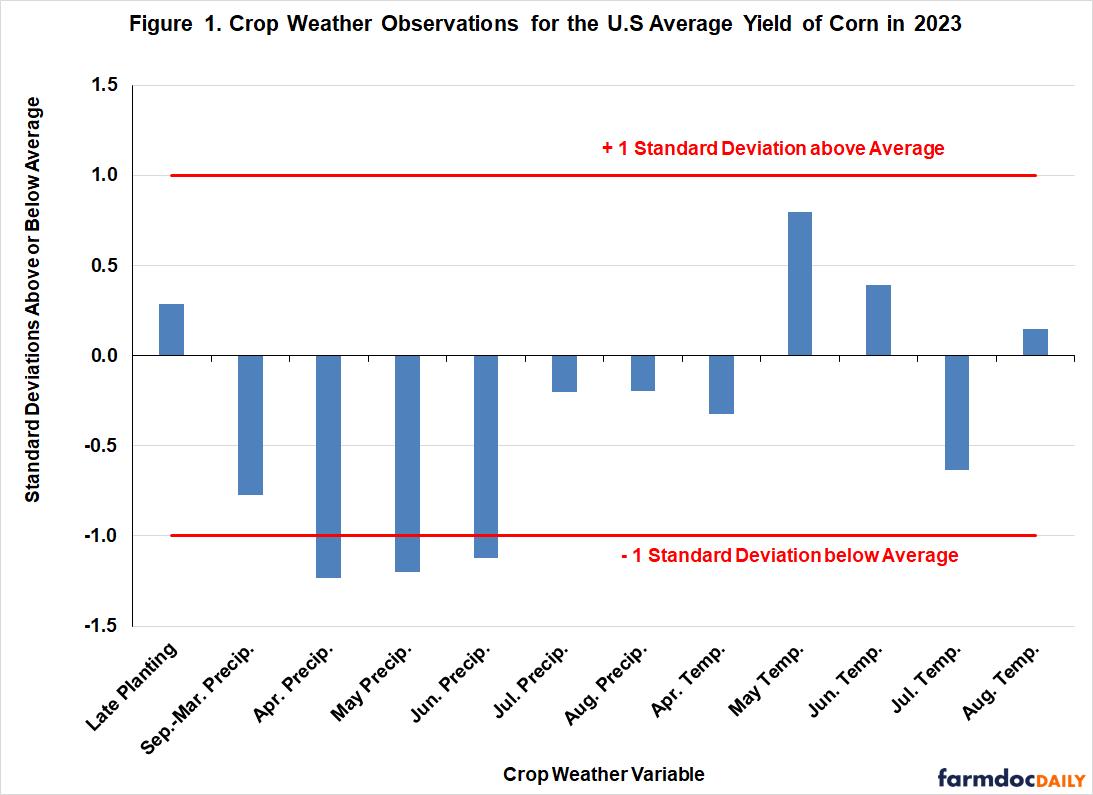
The first task is to examine the crop weather observations for 2023 to determine if growing conditions were extreme or not. Figure 1 provides a standardized method for comparing the 2023 observations both historically and relative to one another. This is accomplished by expressing the 2023 level of each variable in terms of the number of standard deviations above or below the average for 1980 through 2023. Standard deviation is a statistical measure of the “typical” variation of the crop weather variables through time. A rule-of-thumb is that a range of +/- one-standard deviation from average contains roughly two-thirds of the observations in a sample. For example, the observation for late planting in 2023 was 21.3 percent, which converts to 0.29 standard deviations above the average for this variable over 1980 through 2023. This means that the amount of corn planted late was only slightly above average in 2023 when considering the typical variability of late planting.
With this background, we can consider the 2023 levels of the full set of crop weather variables. Figure 1 clearly shows that conditions started off dry during the preseason (September 2022-March 2023) and continued dry through June. The level of precipitation for each month over April through June in the Corn Belt was more than one-standard deviation below average. The situation improved considerably in July and August, with precipitation being only slightly below average. In terms of temperature, conditions were slightly cooler than average in April, warmer than average in May and June, cooler than average in July, and then slightly warmer than average again in August. The picture that emerges is one where the Corn Belt was warm and quite dry compared to normal through June and then cooler and wetter in July and August. The early dryness allowed a near normal rate of planting progress. It is important to emphasize that this picture is based on weighted-average state level crop weather variables for the Corn Belt. Conditions could have varied substantially from these broad averages for smaller geographic areas.
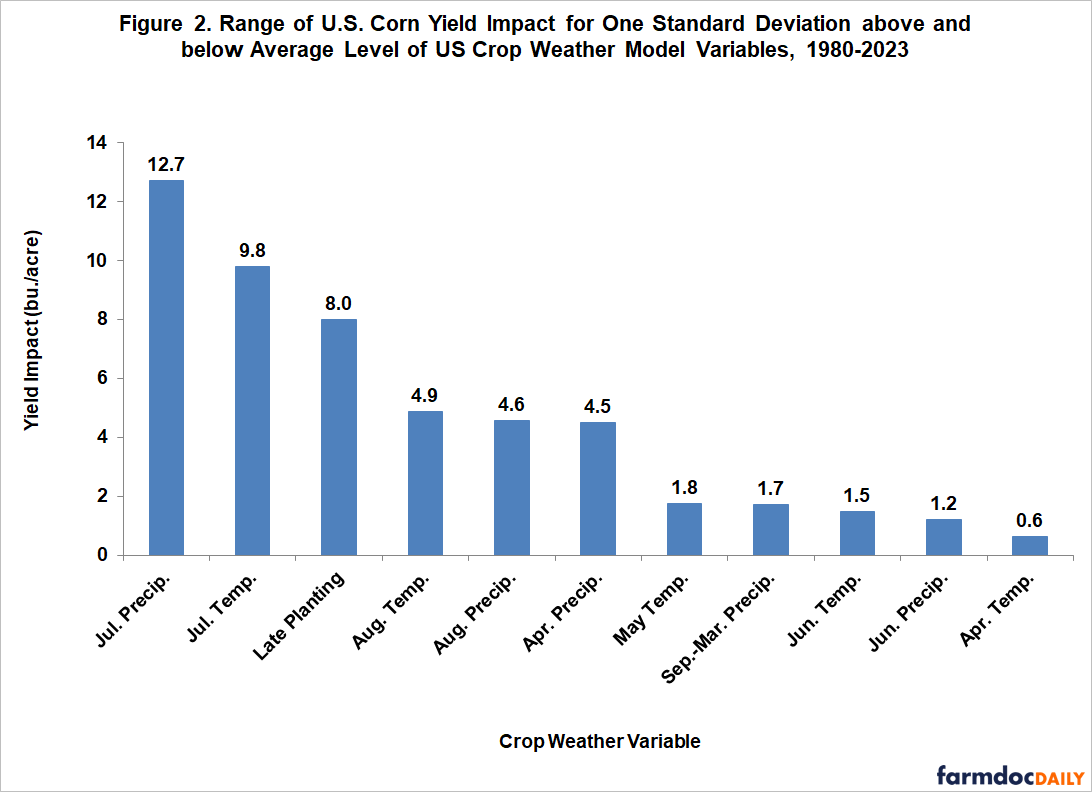
The weather picture for the Corn Belt in 2023 seems to be on the negative side, especially given the early season warmth and dryness. However, the impression from this picture could be misleading if one does not consider the unequal impact of the various crop weather variables on corn yield. The farmdoc daily article from October 9th computed the relative importance of crop weather variables based on both the nature of the relationship between the variables and corn yield and the inherent difference in the variation of the variables. The same computations were updated through 2023 and are presented in Figure 2 for each of the crop weather variables included in the model. Once again, July precipitation is easily the most important variable influencing the U.S. average yield of corn through time. More specifically, the U.S. average yield of corn varies by 12.7 bushels per acre for a one-standard deviation range in July precipitation, or alternatively, about two-thirds of the time the impact of July precipitation on the U.S. average yield of corn is within a range of 12.7 bushels. The second most important variable is July temperature with a range of 9.8 bushels per acre, and the third is late planting with a range of 7.7 bushels. The “big three” for determining the U.S. average yield of corn are July precipitation, July temperature, and late planting, with July precipitation taking the lead.
Comparison of Figures 1 and 2 goes a long way towards explaining how the U.S. average yield of corn could have reached a new record level in in 2023. Even though warm and dry conditions prevailed from April through June, weather during these three months has only a modest impact on corn yield, with the possible exception of April precipitation. In addition, the same warm and dry conditions allowed the corn crop to be planted in a timely manner, and late planting is the third most important crop weather variable. This helped to offset some of the negative impacts on yield of the early warm and dry conditions. The sudden turn in the weather to more positive conditions in July and August occurred at precisely the most important time for the 2023 corn crop. Precipitation and temperature during these two months represent four of the top five yield influencing factors in the crop weather model. Note in particular that July precipitation was near normal, and temperature was well below normal. These are near ideal conditions in the most critical reproductive period for determining corn yields in the U.S. One might even say that U.S. corn producers were saved by the bell as far as July 2023 weather was concerned.
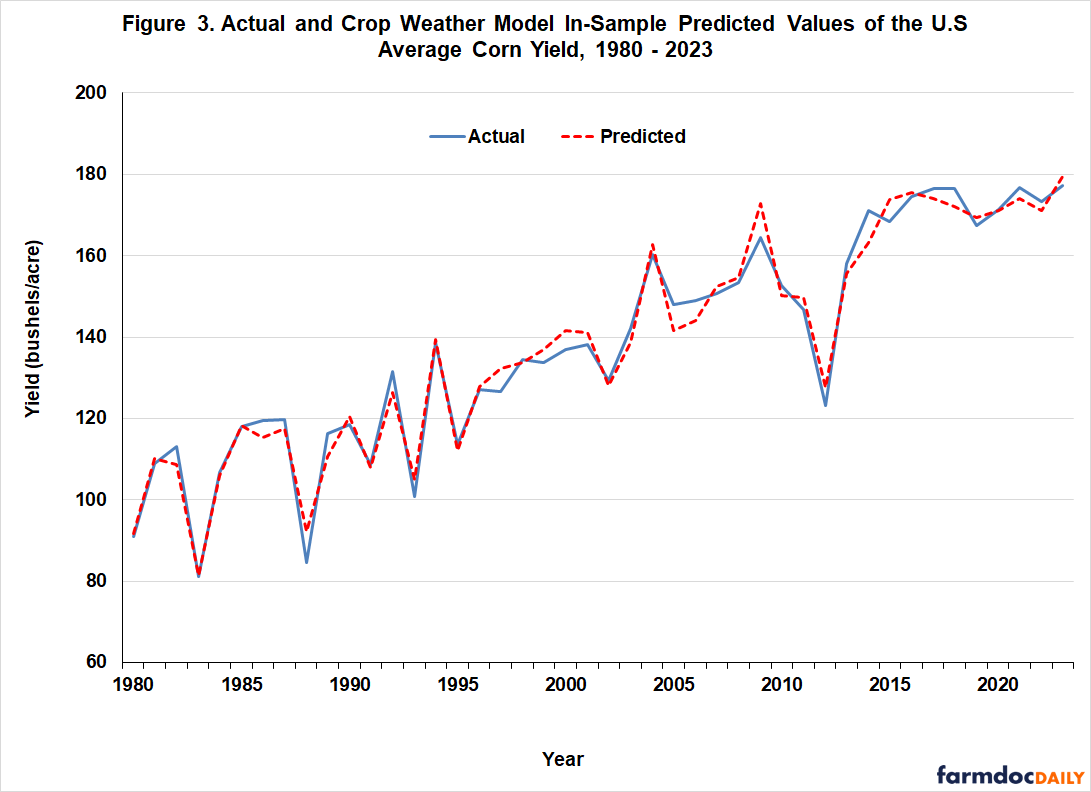
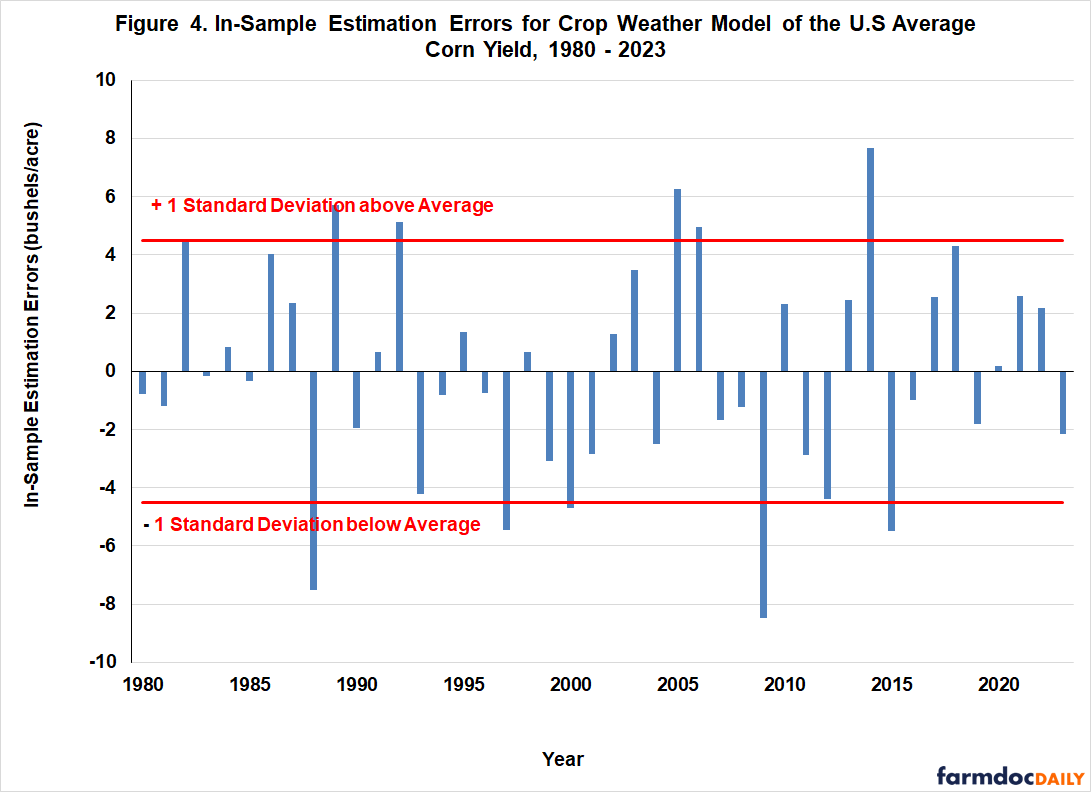
We can formalize the analysis by directly computing predicted values for the 2023 U.S. average corn yield using the crop weather model and observations for the variables. There are two ways to do this. The first is to estimate the model over 1980 through 2023 and then examine the model prediction relative to the actual yield. This is termed an “in-sample” prediction analysis. Figures 3 and 4 present the results of this exercise, with Figure 3 presenting the level of actual and predicted yields and Figure 4 presenting prediction errors (difference between actual and predicted yields in Figure 3). Starting with Figure 3, it is clear that the model is able to predict the observed yield of corn reasonably closely in most years, including 2023. More specifically, the predicted yield for 2023 was 179.4 bushels per acre, only 2.1 bushels higher than the final yield, and well within in the normal bounds of in-sample prediction errors.
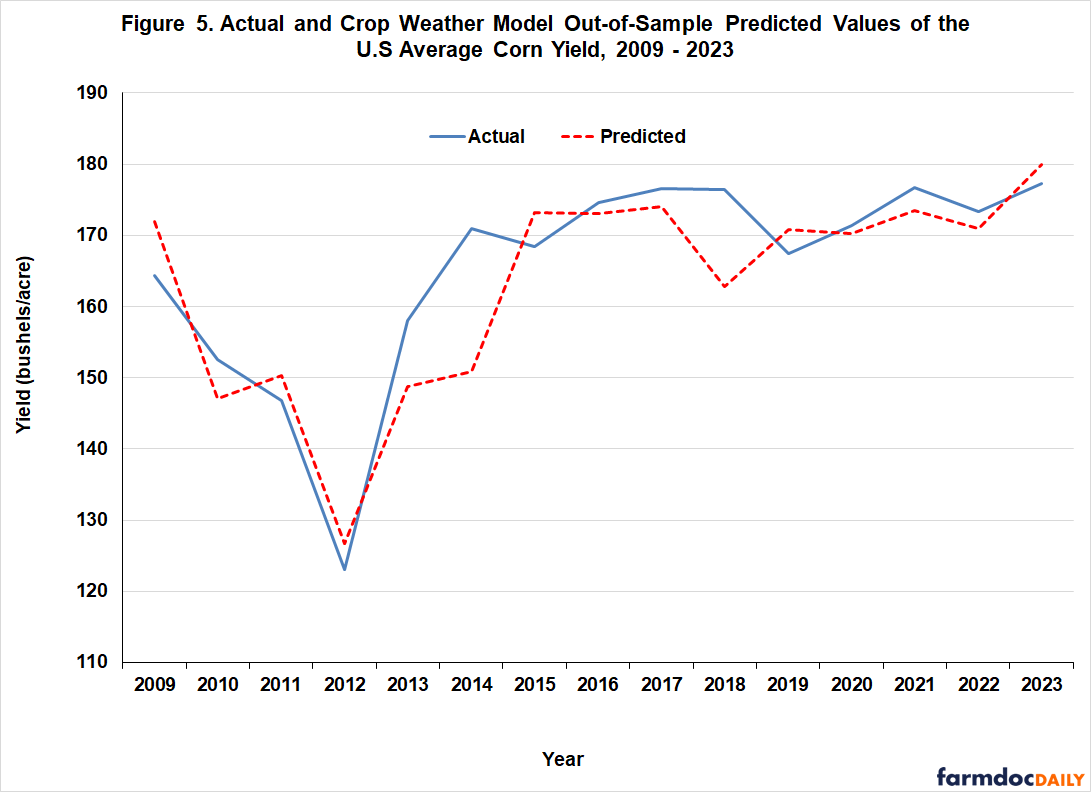
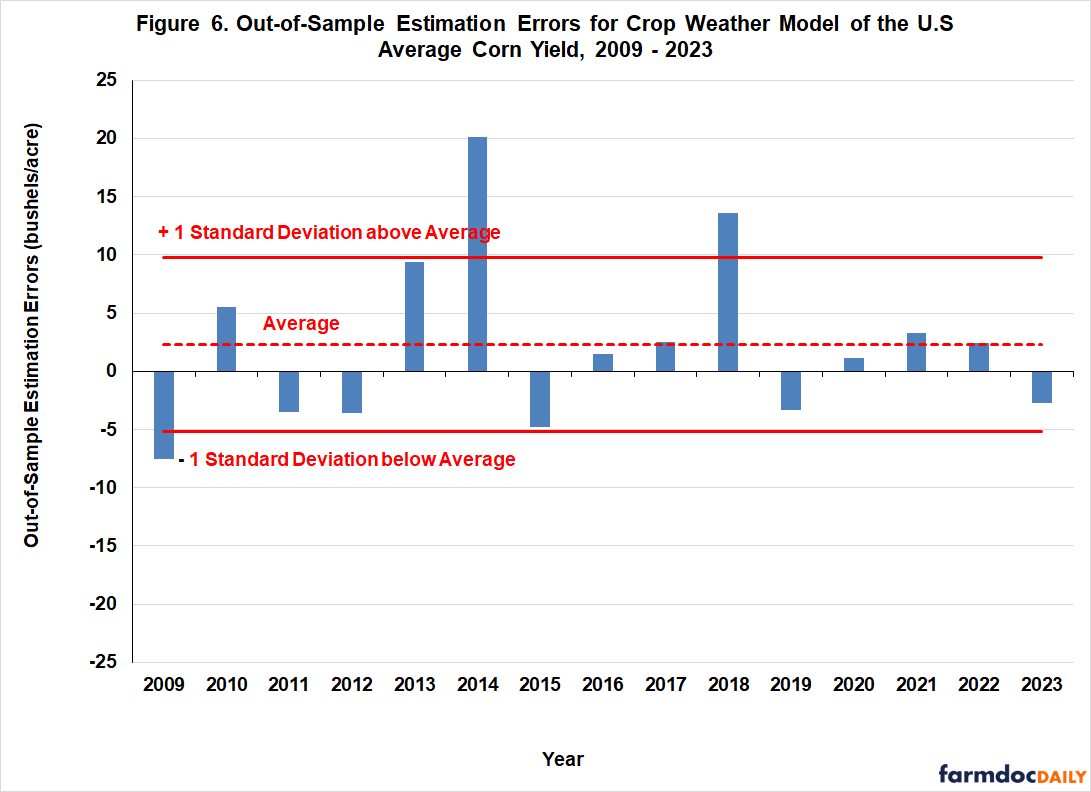
The second method is to predict the U.S. average yield of corn “out-of-sample” by using a recursive process. For example, the crop weather model is estimated using data from 1980 through 2022 and then actual observations for the variables for 2023 are used to predict yield in 2023. Likewise, the model is estimated using data from 1980 through 2021 and then actual observations for the variables for 2022 are used to predict yield in 2022, and so on. This is a more rigorous method for assessing the accuracy of the crop weather model because it more closely aligns with the way the model would be used in “real time” forecasting. We follow this procedure for the 15 years from 2009 through 2023 in order to have enough out-of-sample years to assess whether the 2023 prediction error was unusually large.
The results of the out-of-sample prediction exercise are presented in Figures 5 and 6, with Figure 5 presenting the level of actual and predicted yields over 2009 through 2023 and Figure 6 presenting prediction errors (difference between actual and predicted yields in Figure 5). As expected, Figure 5 shows that out-of-sample prediction errors tend to be larger than in-sample errors because the estimation period for the crop weather model does not include the prediction year. Nonetheless, the crop weather model predicts the observed yield of corn reasonably closely in most out-of-sample years, including 2023. The predicted out-of-sample yield for 2023 was 180 bushels per acre, 2.7 bushels higher than the final yield of 177.3 bushels. Figure 6 shows that out-of-sample prediction errors were generally +/- five bushels per acre but some large errors were observed in certain years. In particular, large errors occurred in 2014 and 2018, years of unusually good growing conditions and high yields. Also, note that the average prediction error out-of-sample is not constrained to be equal to zero as it was for the in-sample prediction exercise. Finally, the out-of-sample prediction error of -2.7 bushels for the crop weather model in 2023 was also well within the normal bounds of errors for the last 15 years.
Implications
The 2023 U.S. average corn yield set a new record and surprised many observers given the drought conditions faced by large parts of the Corn Belt at some point in the growing season. We use a crop weather model of the U.S. yield of corn to determine whether the 2023 yield was truly surprising given growing conditions. Weather conditions in the Corn Belt during 2023 were indeed warm and quite dry through June. An underappreciated benefit of the early dryness was that it allowed a near normal rate of planting progress. A sudden turn in the weather to more positive conditions in July and August occurred at precisely the most important time for the 2023 corn crop. Of particular importance, July precipitation was near normal and July temperature was well below normal. These were near ideal conditions in the most critical reproductive period for determining corn yields in the U.S. Both in-sample and out-of-sample prediction exercises for the crop weather model confirmed this basic insight. For example, the out-of-sample predicted yield for 2023 was 180 bushels per acre, only 2.7 bushels higher than the final yield, and well within in the normal bounds of prediction errors for the last 15 years. It is safe to conclude that U.S. corn producers were saved by the bell as far as July 2023 weather was concerned. Lastly, it is important to emphasize that the analysis was based on weighted-average crop weather variables for the entire Corn Belt. Conditions could have varied substantially from these broad averages for smaller geographic areas.
References
CropProphet, “2023 US Corn Yield in Review,” March 14, 2024. https://www.cropprophet.com/2023-us-corn-yield-review/
Hirtzer, M. “US Corn Farmers Defy a Scorching Summer to Grow Record Corn Crop.” Bloomberg, November 10, 2023. https://www.bloomberg.com/news/newsletters/2023-11-10/us-corn-farmers-defy-summer-drought-extreme-heat-for-a-record-crop?sref=4tHCqAJ8
Irwin, S. "The Relative Impact of Crop Weather Variables on the U.S. Average Yield of Corn." farmdoc daily (13):184, Department of Agricultural and Consumer Economics, University of Illinois at Urbana-Champaign, October 9, 2023.
Paulson, N., G. Schnitkey, C. Zulauf and J. Baltz. "The Curious Case of US Corn Yields in 2023." farmdoc daily (14):55, Department of Agricultural and Consumer Economics, University of Illinois at Urbana-Champaign, March 19, 2024.
Disclaimer: We request all readers, electronic media and others follow our citation guidelines when re-posting articles from farmdoc daily. Guidelines are available here. The farmdoc daily website falls under University of Illinois copyright and intellectual property rights. For a detailed statement, please see the University of Illinois Copyright Information and Policies here.


