


Solvency Trends for Illinois Grain Farms
This article examines the debt-to-asset ratio trends of Illinois grain farms using data obtained from the Illinois Farm Business Farm Management (FBFM). The debt-to-asset ratio is a measure of solvency and financial risk that expresses the share of a farm’s total assets that are owed to creditors. It is calculated by dividing the value of a farm’s total liabilities by its total assets. In other words, it measures a farm’s ability to pay off all of its liabilities with its total assets.[1] In our analysis, we report the annual average total assets and total liabilities of grain farms in Illinois by the size of their gross farm returns—small, medium-sized, and large. We define small farms as those with gross farm returns less than $350,000, medium-sized farms as those with returns between $350,000 and $999,999, and large farms as those with returns greater than $999,999. We then use these total liability and total asset values to calculate the implied debt-to-asset ratio (hereafter, debt-to-asset ratio). This approach will also allow us to discuss the relative changes in total assets and total liabilities driving the debt-to-asset ratio trends.
According to the Farm Financial Scorecard[2] developed by the Center for Farm Financial Management, a farm with a debt-to-asset ratio that is greater than 0.6 is categorized as vulnerable, a ratio between 0.3 and 0.6 is categorized as stable, and a ratio that is less than 0.3 is categorized as strong. The greater the debt-to-asset ratio, the greater the financial risk a farm faces. A ratio greater than 0.5 indicates a greater proportion of a farm’s assets are financed by debt rather than the owner’s equity. In our figures below, we use the color-coding system of the Farm Financial Scorecard to indicate the category under which the average farm’s debt-to-asset ratio belongs. The region shaded in red indicates a vulnerable ratio, while yellow indicates a stable ratio, and green indicates a strong ratio.
How Has the Debt-to-Asset Ratio Trended over the Past 20 Years?
Figure 1 shows the average fair market value of total assets, the average total liabilities, and the debt-to-asset ratio of grain farms in Illinois. Over the past two decades, the debt-to-asset ratio for Illinois grain farms has shown a downward trend. In 2003, the debt-to-asset ratio was 0.273 (strong), with average total liabilities of $342,821 and average total assets of $1,256,014. Except for one year, between 2003 and 2012, total assets grew faster than total liabilities, which improved the ratio from 0.273 (strong) to 0.189 (strong). This growth in total assets was due to increases in grain prices, which led to higher ending inventory values. Furthermore, changes in tax laws[3] permitted larger year-of-purchase tax deductions on capital assets used in farming operations. By 2012, average total assets had grown to $3,413,395, a 171.76% increase, while average total liabilities had increased by 88.49% to $646,176.
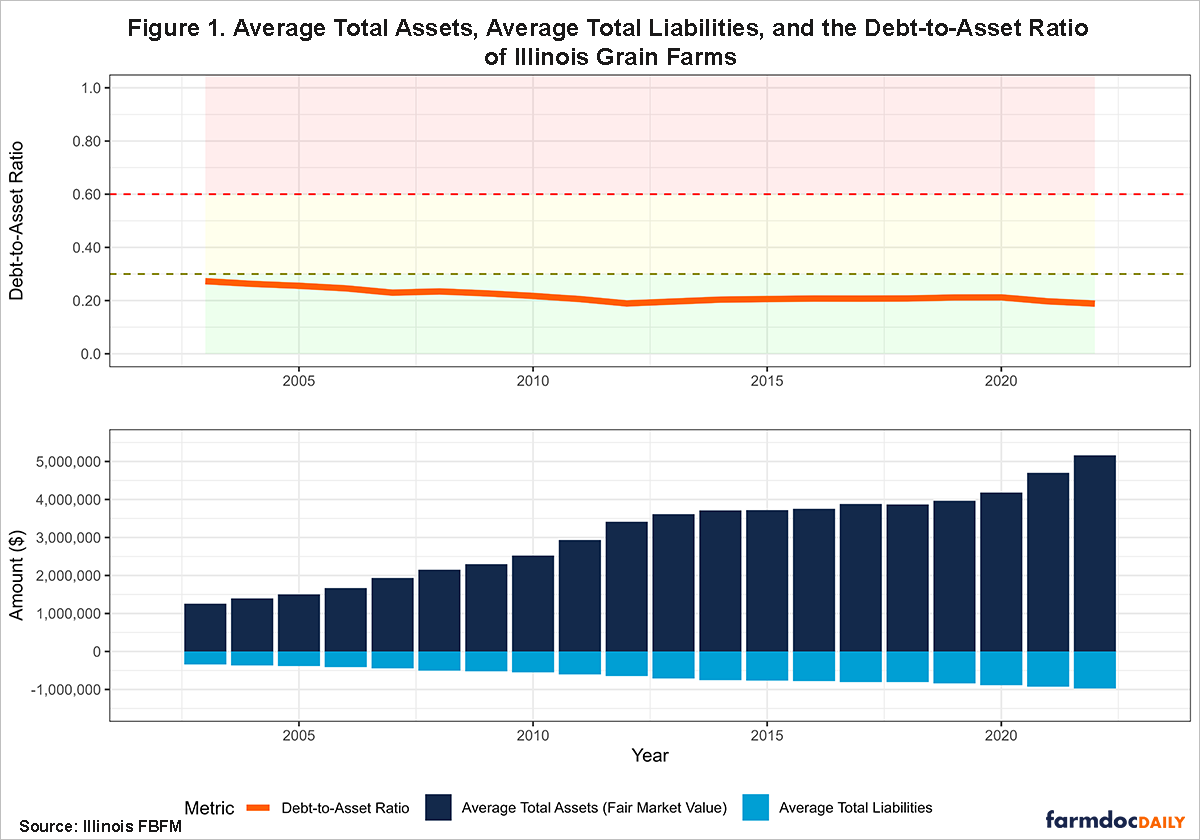
However, in all but one year from 2013 to 2020, average total liabilities grew faster than average total assets. The decrease in grain prices over this period resulted in lower ending inventory prices, which in turn lowered current assets. Moreover, the combination of lower prices and higher operating expenses led to lower net farm incomes, resulting in less operating cash. As a result, farming operations had to increase their operating debt. This shift pushed the debt-to-asset ratio up slightly and increasingly higher over the years, peaking at 0.212 (strong) in 2019 and 2020. During this period, average total assets had increased by 22.52% from $3,413,395 to $4,182,158, while average total liabilities had increased by 37.34% from $646,176 to $887,479. Subsequently, the debt-to-asset ratio fell to 0.197 (strong) and 0.189 (strong) in 2021 and 2022, respectively, as average total assets increased at a faster pace than average total liabilities in both years. The rise in grain prices resulted in higher inventory prices and increased farm incomes, reducing the need for operating debt. As of 2022, average total assets stood at $5,161,982, while average total liabilities stood at $974,505.
How Does the Debt-to-Asset Ratio Trend Vary by Farm Size?
Figure 2 shows the average fair market value of total assets, the average total liabilities, and the debt-to-asset ratio of grain farms in Illinois, categorized by the size of their gross farm returns. Over the past two decades, grain farms with smaller gross farm returns have consistently maintained a stronger solvency position compared to their larger counterparts. In 2003, the debt-to-asset ratio of small grain farms was 0.232 (strong), compared to 0.336 (stable) and 0.483 (stable) for medium-sized and large farms, respectively. The solvency positions for all three farm size categories strengthened from 2003 to 2012. Small grain farms improved their debt-to-asset ratios from 0.232 (strong) to 0.118 (strong), whereby average total assets increased by 73.38%, while average total liabilities decreased by 11.78% over the period. The debt-to-asset ratio of medium-sized grain farms improved from 0.336 (stable) to 0.171 (strong), driven by a 60.39% increase in average total assets and an 18.06% decrease in average total liabilities over the same period. Large farms had a considerably higher debt-to-asset ratio compared to small and medium-sized farms in 2003. However, they managed to improve their ratio from 0.483 (stable) to 0.231 (strong) by 2012 as average total assets increased by 37.03%, while average total liabilities decreased by 34.47%.
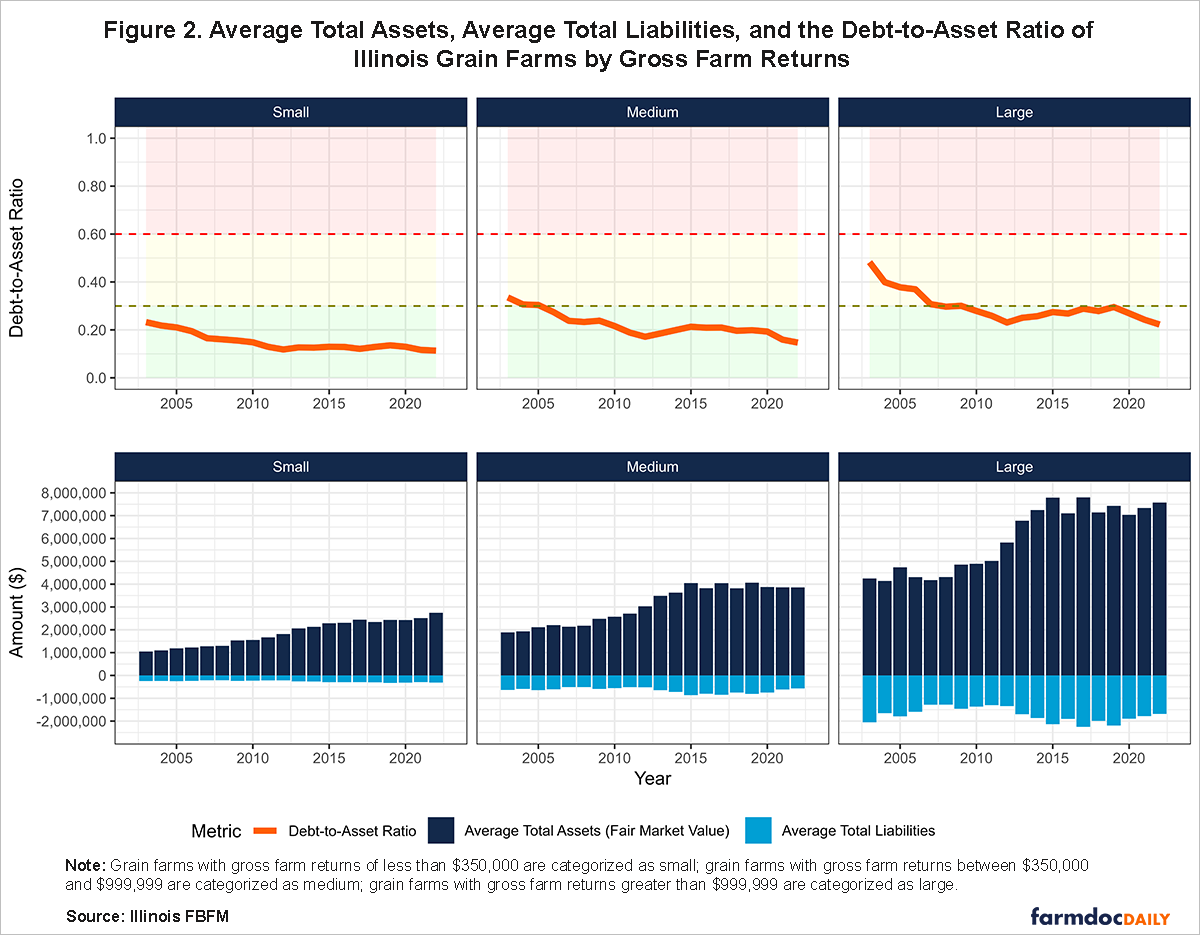
During the first half of the period from 2013 to 2022, the debt-to-asset ratio weakened across all three farm size categories before eventually improving, mainly due to lower prices and accrual net farm incomes. Small farms saw their ratio increase from 0.127 (strong) in 2013 to a peak of 0.136 (strong) in 2019, before improving to 0.114 (strong) in 2022. During this period, the average total assets of small grain farms increased by 33.24%, while average total liabilities increased by 19.14%.
Medium-sized grain farms experienced a similar trend, with their debt-to-asset ratio increasing from 0.185 (strong) in 2013 to a peak of 0.213 (strong) in 2015. The ratio then gradually fell over the next few years and sharply declined in 2021 to 0.159 (strong). As of 2022, the debt-to-asset ratio of medium-sized grain farms was 0.147 (strong). Over the period, total assets for medium-sized farms increased by 10.72%, while total liabilities fell by 12.05%.
Large grain farms experienced the sharpest increase in debt-to-asset ratio during the period, rising from 0.251 (strong) in 2013 and peaking at 0.295 (strong) in 2019, before falling sharply to 0.222 (strong) in 2022. Over the same period, the average total assets of large grain farms increased by 11.77%, while average total liabilities decreased by 0.80%.
Summary
Overall, the debt-to-asset ratio of Illinois grain farms has trended downward over the past two decades, indicating an improvement in solvency and a reduction in financial risk. The debt-to-asset ratio has consistently been lower for smaller farms compared to medium-sized and large farms. Some of the differences in farm size and debt-to-asset ratios can be attributed to the age of the farmer. Typically, younger farmers have smaller farm sizes and much higher debt-to-asset ratios. When farmers reach the age group of 50 to 59 years, the size of the farm begins to decrease while debt-to-asset ratios continue to increase. Initial findings from 2023 indicate that the average debt-to-asset ratio remained similar to that of 2022, despite much lower prices at the end of the year. However, projections for 2024 suggest that lower prices, as well as the potential for higher operating loan balances and accrued interest, may increase debt-to-asset ratios.
Acknowledgment
The authors would like to acknowledge that data used in this study comes from the Illinois Farm Business Farm Management (FBFM) Association. Without Illinois FBFM, information as comprehensive and accurate as this would not be available for educational purposes. FBFM, which consists of 5,000+ farmers and 70 professional field staff, is a not-for-profit organization available to all farm operators in Illinois. FBFM field staff provide on-farm counsel along with recordkeeping, farm financial management, business entity planning and income tax management. For more information, please contact our office located on the campus of the University of Illinois in the Department of Agricultural and Consumer Economics at 217-333-8346 or visit the FBFM website at www.fbfm.org.
Notes
[1] We use the market value of total assets in our analysis.
[2] The Farm Financial Scorecard adheres to the guidelines set by the Farm Financial Standards Council.
[3] This includes a larger expense election and the introduction of special depreciation at 30%, which can be increased to 100% of the purchase price deduction in the year of purchase.
Disclaimer: We request all readers, electronic media and others follow our citation guidelines when re-posting articles from farmdoc daily. Guidelines are available here. The farmdoc daily website falls under University of Illinois copyright and intellectual property rights. For a detailed statement, please see the University of Illinois Copyright Information and Policies here.