


How California’s New Locomotive Regulation Could Impact Midwest Agriculture
California’s In-Use Locomotive Regulation establishes new requirements and standards for locomotives that operate in the state, which, if authorized, could have economic implications beyond the state’s borders and negatively impact agricultural producers that rely on rail transport, particularly those in the Midwest. This article examines the California In-Use Locomotive Regulation and its potential to change how farm and food products are transported across the United States. Among others, potential impacts include increased transportation costs and shifts in logistic strategies. As railroads operating in California would have to make new investments to comply with zero-emission mandates, these costs may result in lower prices to agricultural producers and higher costs to their customers both domestically and in export markets. Potential spillover effects could result in broader adoption of this regulation in other U.S. states, elevating national-level considerations that could influence food prices, farm income, and export competitiveness, further complicating agricultural supply chains.
Background
The California Air Resources Board (CARB) finalized rulemaking for the In-Use Locomotive Regulation in 2023, with an effective date of January 1, 2024. According to CARB, the regulation is designed to achieve emission reductions from diesel-powered locomotives and increase the use of zero-emission (ZE) technology to meet California’s public health, air quality, and climate goals (CARB, 2024). Table 1 summarizes the key components of the regulation. Most notable are the in-use operational requirements, which enter into force on January 1, 2030, and prohibit the use of locomotives more than 23 years old unless they meet the cleanest locomotive exhaust emission standard of the U.S. Environmental Protection Agency (EPA). Also, in 2030, switch, industrial, and passenger locomotives with engine build dates of 2030 or newer must be operated in a ZE configuration in California. This requirement will apply to freight line haul locomotives in 2035. CARB must assess commercial ZE locomotive technologies in 2027 (for switch) and 2032 (for line haul) and adjust these requirements if necessary. The regulation also provides for some alternative compliance options.
Table 1. Summary of California’s In-Use Locomotive Regulation |
|
| Category | Details |
| Spending Account | Locomotive operators will be required to fund their own trust account based on the emissions created by their locomotive operations in California. Funds will be used for:
– Until 2030, to purchase, lease, or rent Tier 4 or cleaner locomotives, or for the remanufacture or repower to Tier 4 or cleaner locomotives. – At any time, to purchase, lease or rent ZE locomotives, ZE capable locomotives, ZE rail equipment, or to repower to ZE locomotives or ZE capable locomotives. – At any time, for ZE infrastructure associated with ZE locomotives, ZE capable locomotives, ZE rail equipment. – At any time, to pilot or demonstrate ZE locomotives or ZE rail equipment technologies. |
| In-Use Operational Requirements (2030) | Only locomotives less than 23 years old will be able to be used in California.
Switchers operated by Class I, Class III, industrial and passenger locomotive operators with an original engine build date of 2030 and beyond must operate in a ZE configuration in California. Class I line haul locomotives with an original engine build date of from 2035 and beyond must operate in a ZE configuration in California. |
| Idling Limit | Locomotives with automatic shutoff cannot idle for more than 30 minutes, with exemptions for specific operational needs. |
| Registration and Reporting | Mandatory registration with CARB.
Annual reporting of locomotive activity, emissions, and idling data, along with an annual administrative payment. |
| Additional Options Under the Regulation | In lieu of the Spending Account, the In-Use Operational Requirements, or both:
Alternative Compliance Plan that allows operators to reduce emissions through other strategies Alternative Fleet Milestone Option that allows operators to reduce emissions by committing to four operational milestones that increase the share of annual fleet usage in California to cleaner locomotives by specified dates, leading up to 100% ZE locomotives by 2047. Temporary operating and compliance extensions under specific circumstances. Temporary extensions for small businesses. Exemptions for historic locomotive operators that meet specific requirements. |
| Source: CARB (2024). | |
Because these requirements differ from federal emissions standards, EPA must grant California a waiver to adopt and enforce the regulation, which is consistent with the Clean Air Act (CAA). On November 7, 2023, CARB submitted an authorization request to EPA, which provided notice of the request in February and held a public hearing in March. The comment period closed on April 22, 2024, with 2,600 comments received (EPA, 2024). As of the publication date, EPA had not yet announced if a waiver would be granted. The criteria for grating authorization requires that California determines its standards will be, in the aggregate, at least as protective of public health and welfare as the federal standard; however, authorization will not be granted if EPA finds that 1) California’s determination is arbitrary and capricious, and/or 2) California does not need such standards to meet compelling and extraordinary conditions, and/or 3) The California standards and enforcement procedures are not consistent with section 209 of the CAA (42 USC 7543), which includes a prohibition on state emission standards for new locomotives or new engines used in locomotives.
Based on an initial review of comments submitted to EPA, some public health and environmental groups have come out in favor of the regulation and support authorization. At the same time, stakeholders representing agriculture and other sectors that rely on rail transportation, as well as the railway companies and their associations, have expressed opposition (EPA, 2024). Agricultural and agribusiness stakeholders in California raised concerns about being able to move farm products and inputs in and out of the state, noting that capacity in other transportation modes (such as trucking) is insufficient, not to mention more air polluting. National and state agricultural associations warned that the cost of compliance would be passed back to producers and raise food prices. Many stakeholders noted that California’s regulation, if authorized, could be adopted in other U.S. states, creating a patchwork of different regulatory systems that would create uncertainty, raise costs, and negatively impact national and global supply chains. Notably, the Surface Transportation Board (STB) submitted comments to the EPA, raising concerns about the significant impact on interstate rail transportation as well as the potential for patchwork regulation that is preempted under the ICC Termination Act of 1995 (ICCTA, 1995).
Potential Impact on Midwest Agriculture
If EPA authorizes the regulation, the stakes in the Midwest states could be exceptionally high due to the region’s heavy reliance on rail for transporting agricultural goods. As shown in Table 2, agricultural and food exports from Midwest states were valued at nearly $100 billion in 2022. Agricultural exports have grown remarkably during the last decade, with soybeans and corn driving much of that increase. In 2022, soybeans accounted for almost 30 percent of the total Midwest farm and food products export value, while corn comprised about 17 percent. This export growth depends on efficient and cost-effective rail transportation to move agricultural commodities to West Coast ports.
Table 2. Agricultural Exports from the Midwest Doubled in Real Terms Since 2012 |
|||||||||
| United States | Midwest | ||||||||
| Export Value (in million $) | Export Share (in %) | Export Value (in million $) | Export Share (in %) | ||||||
| Products | 2022 | Avg. 2012-21 | Avg. 2012-21 | Avg. 2012-21 | 2022 | Avg. 2012-21 | 2022 | Avg. 2012-21 | |
| Beef and veal | 11,708 | 5,397 | 6.2 | 5.3 | 6,049 | 2,702 | 6.2 | 5.7 | |
| Broiler meat | 4,280 | 2,630 | 2.3 | 2.6 | 242 | 139 | 0.2 | 0.3 | |
| Corn | 18,571 | 7,265 | 9.8 | 7.1 | 16,141 | 6,195 | 16.6 | 13.0 | |
| Cotton | 8,977 | 3,927 | 4.8 | 3.8 | 539 | 199 | 0.6 | 0.4 | |
| Dairy products | 9,545 | 4,256 | 5.1 | 4.2 | 3,400 | 1,519 | 3.5 | 3.2 | |
| Feeds and other feed grains | 12,963 | 6,624 | 6.9 | 6.5 | 10,313 | 5,052 | 10.6 | 10.6 | |
| Fruits, fresh | 4,059 | 3,293 | 2.1 | 3.2 | 159 | 114 | 0.2 | 0.2 | |
| Fruits, processed | 4,103 | 2,917 | 2.2 | 2.9 | 160 | 102 | 0.2 | 0.2 | |
| Grain products, processed | 4,590 | 2,807 | 2.4 | 2.7 | 3,430 | 1,969 | 3.5 | 4.1 | |
| Hides and skins | 1,112 | 1,398 | 0.6 | 1.4 | 650 | 783 | 0.7 | 1.7 | |
| Other livestock products | 4,887 | 2,731 | 2.6 | 2.7 | 1,008 | 594 | 1.0 | 1.3 | |
| Other oilseeds and products | 2,013 | 1,294 | 1.1 | 1.3 | 1,002 | 550 | 1.0 | 1.2 | |
| Other plant products | 19,078 | 11,683 | 10.1 | 11.4 | 3,795 | 2,117 | 3.9 | 4.5 | |
| Other poultry products | 2,742 | 1,489 | 1.5 | 1.5 | 1,294 | 638 | 1.3 | 1.3 | |
| Pork | 7,698 | 4,710 | 4.1 | 4.6 | 5,962 | 3,629 | 6.1 | 7.6 | |
| Rice | 1,720 | 1,363 | 0.9 | 1.3 | 106 | 77 | 0.1 | 0.2 | |
| Soybean meal | 6,120 | 3,453 | 3.2 | 3.4 | 5,132 | 2,840 | 5.3 | 6.0 | |
| Soybeans | 34,368 | 15,871 | 18.2 | 15.5 | 28,815 | 13,064 | 29.6 | 27.5 | |
| Tobacco | 1,053 | 924 | 0.6 | 0.9 | 0 | 3 | 0.0 | 0.0 | |
| Tree nuts | 8,985 | 5,747 | 4.8 | 5.6 | 0 | 1 | 0.0 | 0.0 | |
| Vegetable oils | 4,284 | 2,502 | 2.3 | 2.4 | 3,515 | 1,997 | 3.6 | 4.2 | |
| Vegetables, fresh | 2,825 | 1,763 | 1.5 | 1.7 | 390 | 246 | 0.4 | 0.5 | |
| Vegetables, processed | 4,853 | 3,162 | 2.6 | 3.1 | 669 | 442 | 0.7 | 0.9 | |
| Wheat | 8,323 | 4,922 | 4.4 | 4.8 | 4,610 | 2,507 | 4.7 | 5.3 | |
| Total | 188,857 | 102,126 | 97,379 | 47,479 | |||||
| Note: The table shows agricultural exports from the U.S. and the twelve Midwest states (IA, IL, IN, KS, MI, MN, MO, ND, NE, OH, SD, and WI) obtained from the U.S. Department of Agriculture (USDA, 2024). The State Exports, Cash Receipts Estimates from the Economic Research Services are reported based on the calendar year and compiled from farm cash receipts for exported products in the State Exports, Cash Receipts Estimates dataset. The table compares the export value (in million $) and share (in %) for 2022 against the average for 2012 to 2021. The export value is normalized based on the producer price index (2022 = 100) from FAOSTAT (2024). Light green shading is used to highlight the top 5 farm and food products. | |||||||||
Compliance with the regulation is expected to increase operational costs, leading to higher freight charges. CARB has estimated that the regulation will cost $13.8 billion from 2023 to 2050 for new equipment and labor (CARB, 2024). To the extent to which these increased costs are passed on through higher charges, agricultural producers may receive lower prices for their commodities or weaker basis. In contrast, customers, both domestically and in export markets, may face higher prices, which could influence food prices and export competitiveness. Furthermore, as rail systems adapt to new technologies, there may be temporary disruptions in logistics and service reliability. These costs and disruptions may significantly impact Midwest agricultural producers.
Figure 1 illustrates the reliance of Midwest agriculture on rail transportation. We plotted the origin and destination of the top five farm and food products transported via railways from the Midwest in 2022. Unsurprisingly, California serves as the endpoint for major agricultural shipments from the region, with, for example, about 10 percent of total soybean meal and meat and meat products from the Midwest being shipped to California. Expanding this analysis to other rail destinations on the West Coast, based on the assumption that other U.S. states might adopt the California regulation, the share of farm and food products shipped out of the Midwest to those destinations is about 30 percent of all rail shipments. Notable is the large share of oilseeds and grains railed to the Pacific Northwest (PNW). For instance, 59 percent of soybeans and 74 percent of other grains are exported via the PNW. This vital export hub accounts for approximately 40 to 50 percent of the U.S. grain exports to Asia.
The potential economic implications for some parts of Midwest agriculture could be significant. Elevated shipping costs diminish the competitiveness of U.S. agricultural products, particularly in international markets where producers compete with those from regions with lower logistic costs. Logistical inefficiencies can restrict access to vital markets and decrease market share, potentially reducing annual export revenues by a significant margin as Midwest exporters could struggle to maintain their competitive edge in international markets. The broader economic effects of increased transportation costs could prompt substantial strategic adjustments within the transportation and agricultural sectors. With higher rail costs, there may be a shift toward more localized production and processing to minimize dependence on costly long-distance rail logistics.
Figure 1. Railway Shipments of Midwest Farm and Food Products
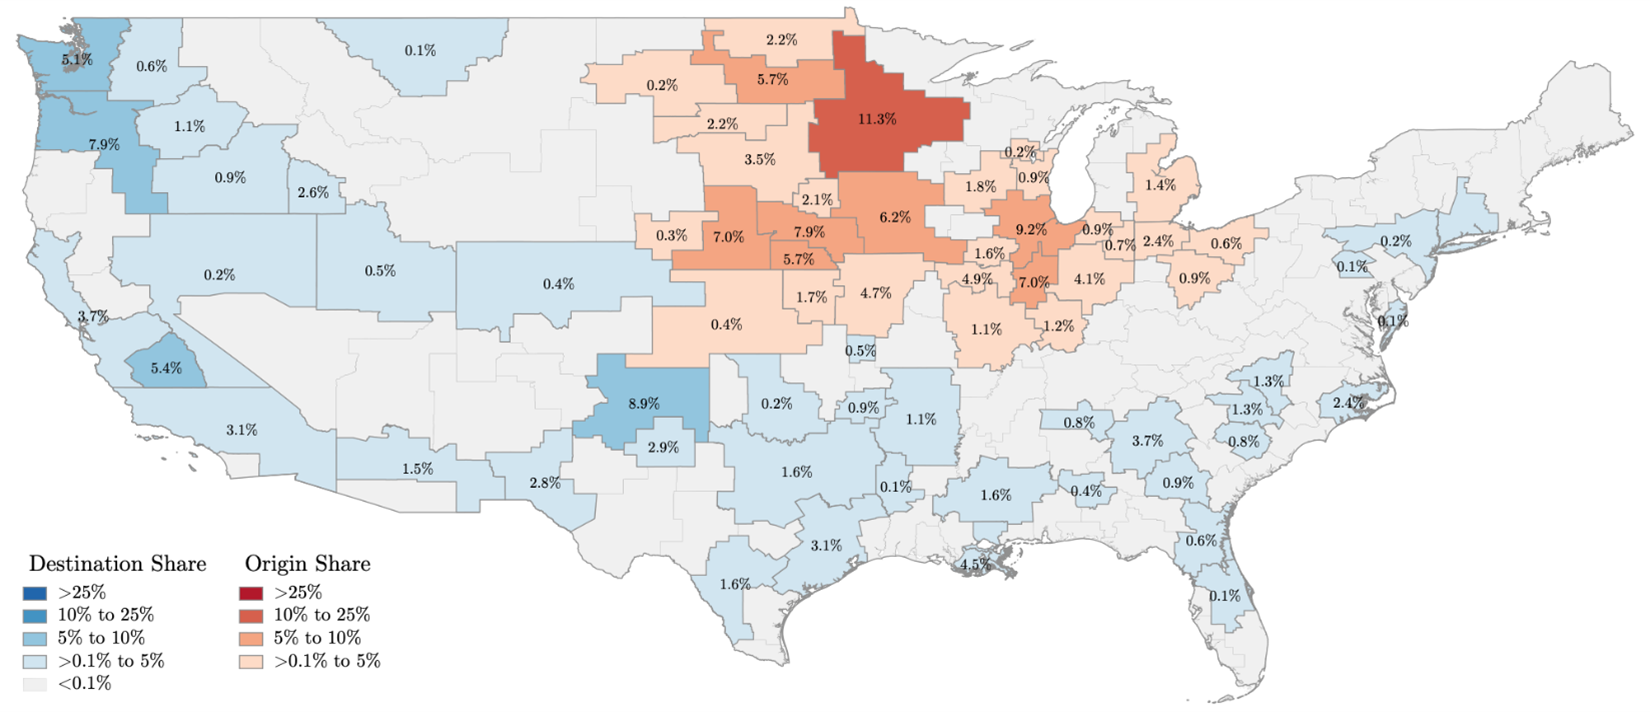
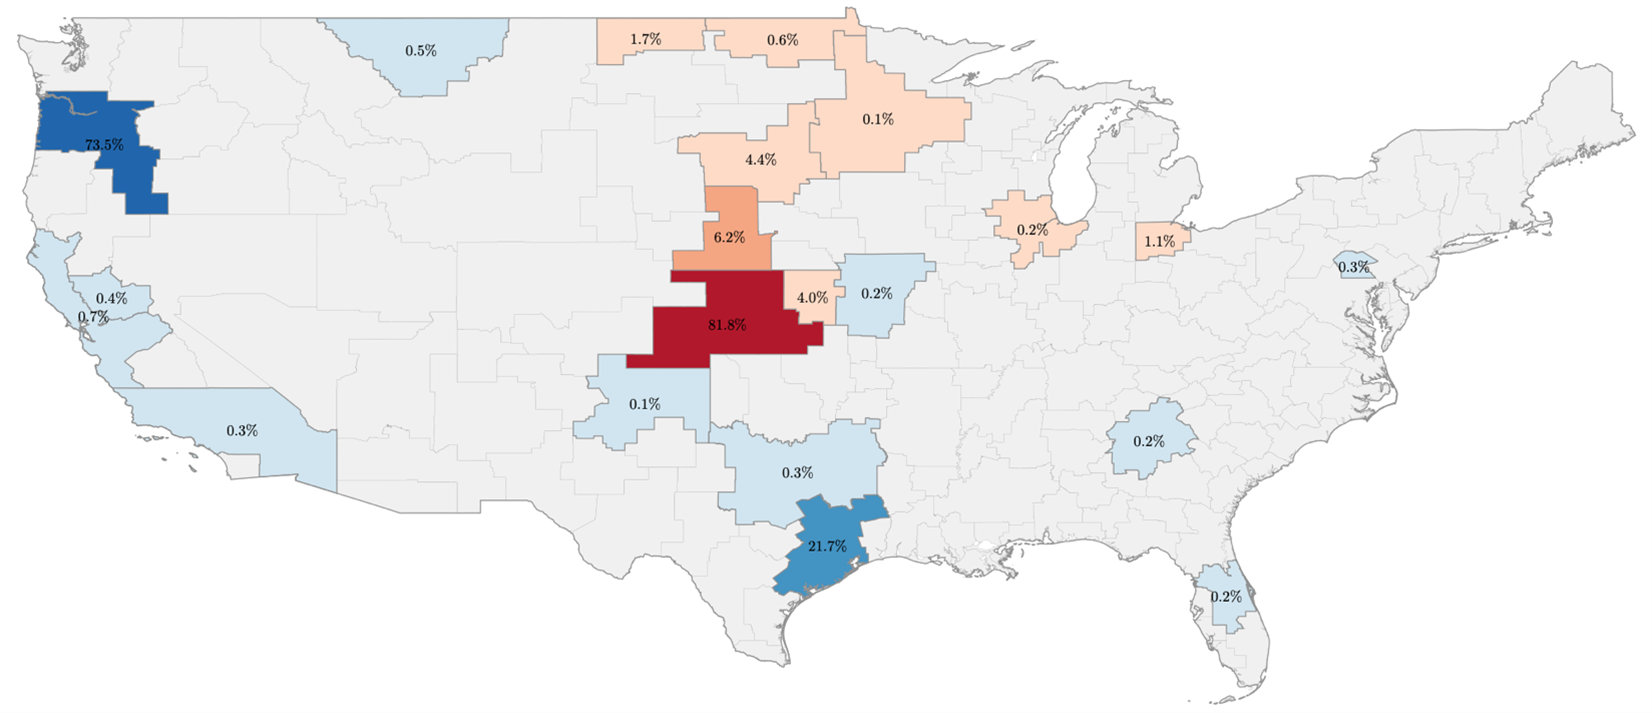
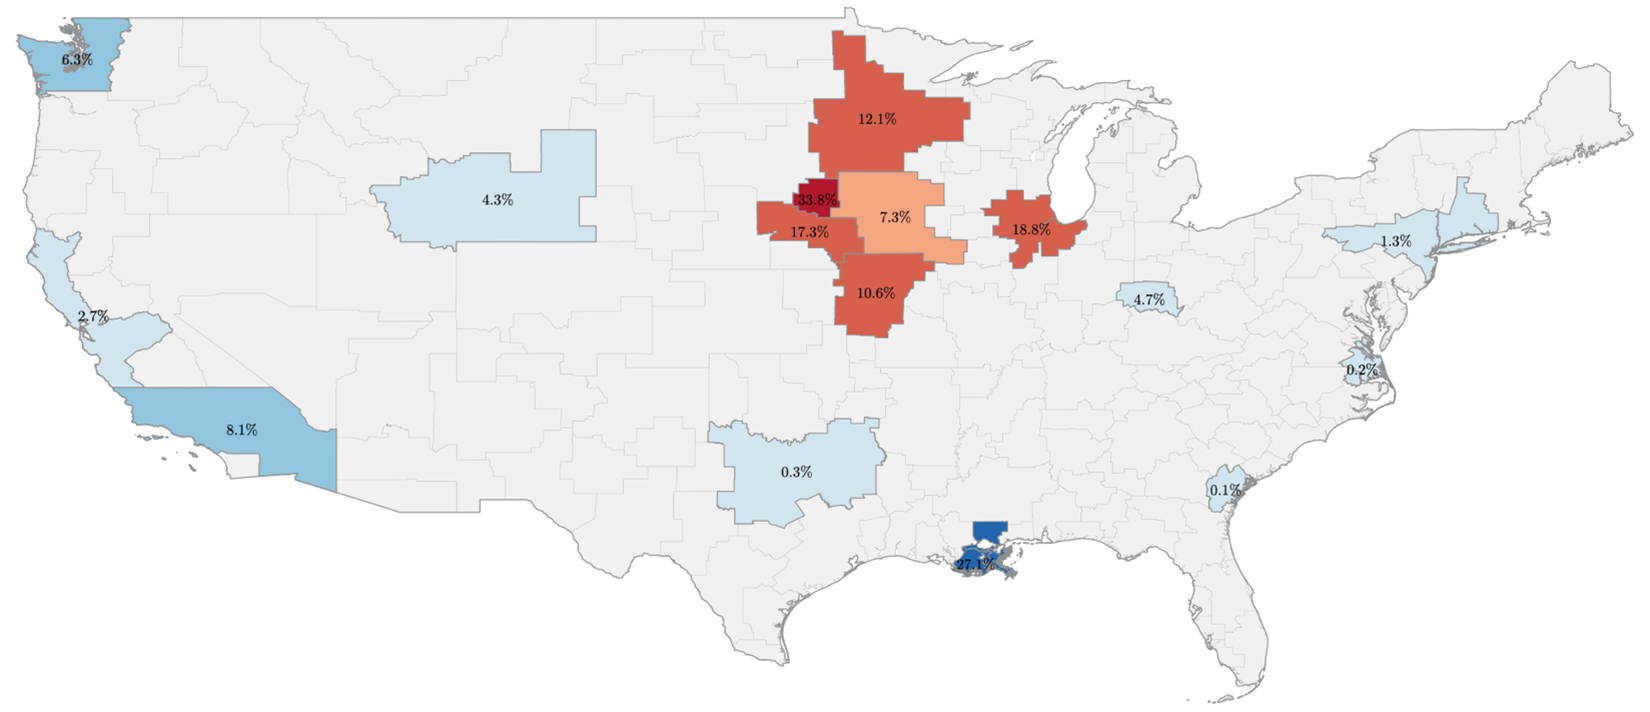
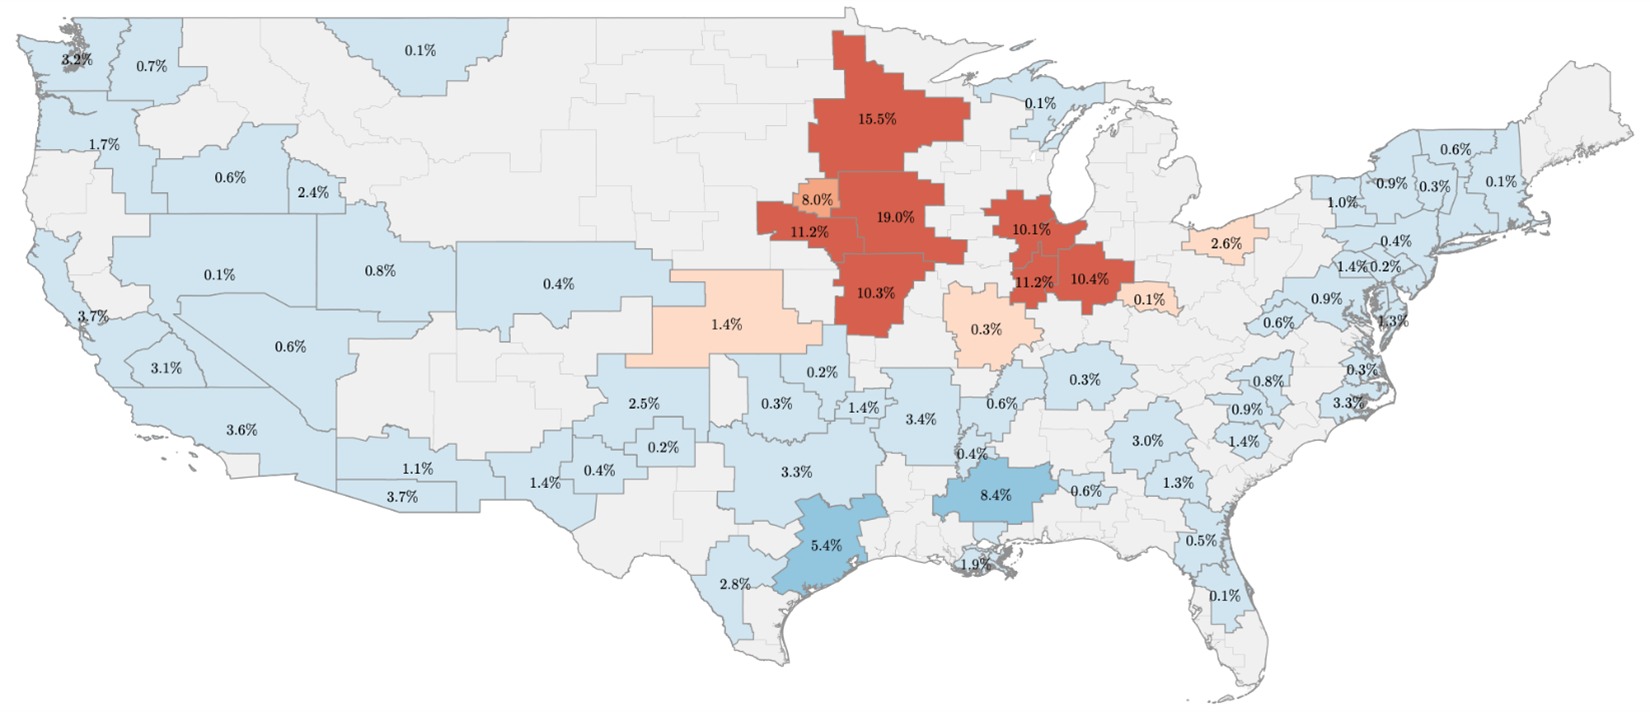
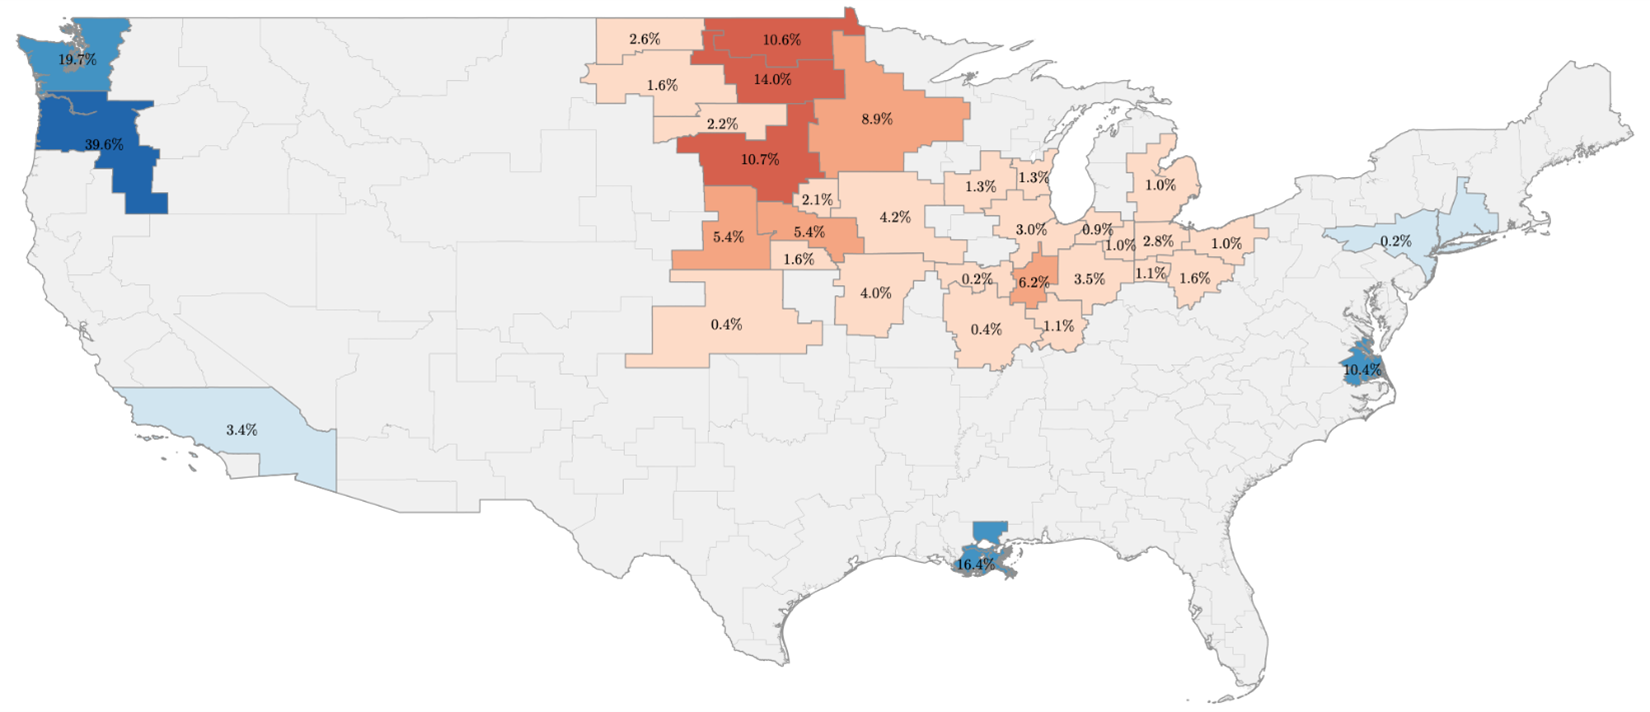
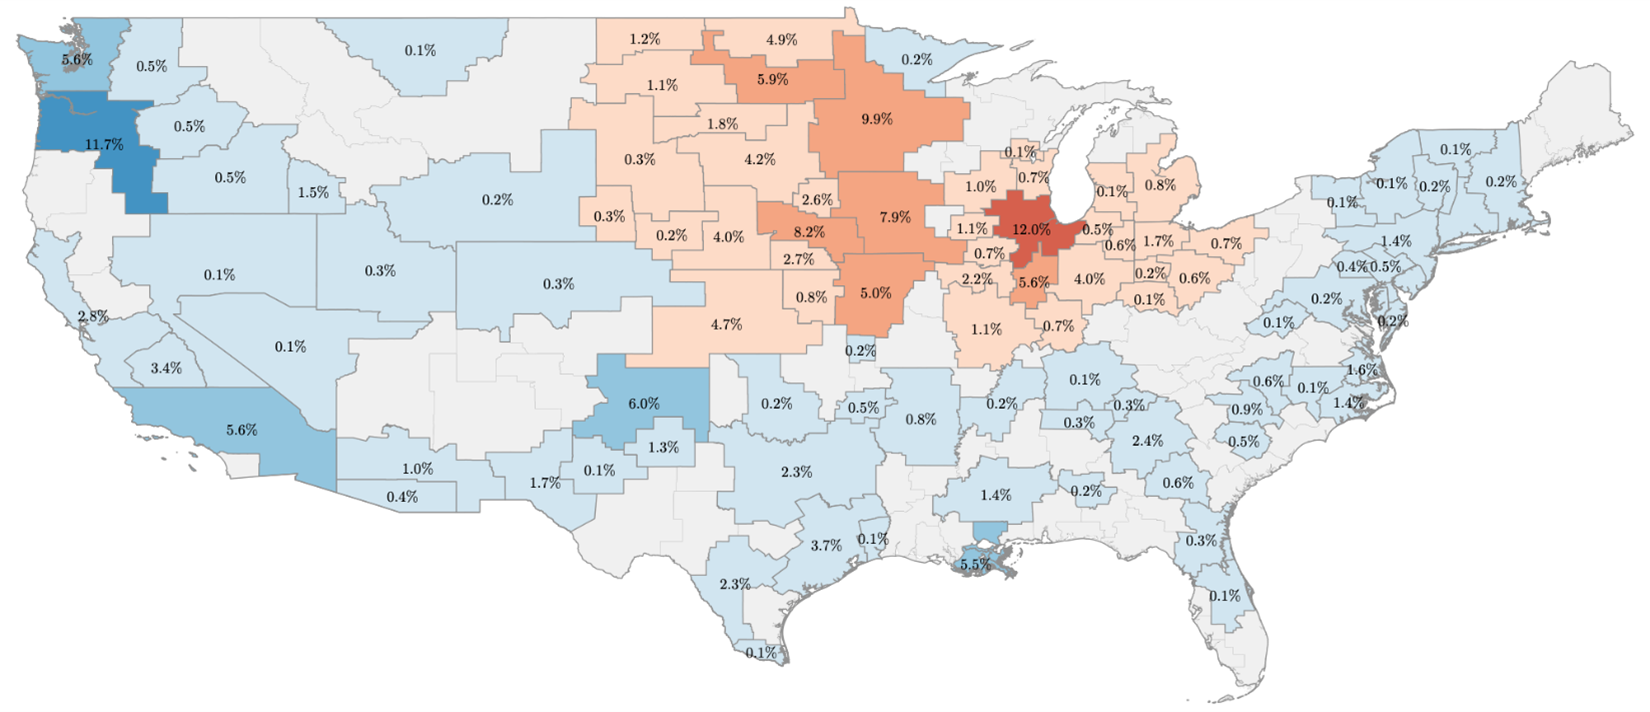
Note: The figure shows the share of farm and food products shipped by rail from the Midwest to non-Midwest locations in the United States. The shares were calculated based on disclosed volumes in the Surface Transportation Board’s public-use Carload Waybill Sample (Surface Transportation Board, 2024). The CWS data is anonymized at the level of the 1998 Bureau of Economic Analysis (BEA) economic regions. Midwest regions were selected based on the condition that most of the economic region is contained in one of the twelve Midwest states. Products were selected based on the CWS 2- to 5-digit commodity codes (STCC). Both bulk and container shipments are included in the calculation. Corn includes STCC 01132; other feed grains STCC 01131, 01133, and 01136, meat and meat products STCC 2012 and 2012; soybean meal STCC 20923; soybeans STCC 01144; and all farm and food products STCC 01 to 02. The shares were calculated based on the total tonnage shipped from the origin to the destination BEA economic region using CWS data for 2022. The legend is provided in sub-figure (a).
Potential Policy Spillover Effects
The CAA allows U.S. states to adopt certain California nonroad emissions standards if the standards are identical in terms of implementation and enforcement to the authorized California standard, the standards are in place for two years before they take effect, and the EPA Administrator is notified the standards are adopted. Notably, they are not required to seek additional EPA approval. Given the experience with other U.S. states adopting California emissions standards (e.g., motor vehicle pollution control standards), stakeholders have raised concerns that the California regulation for locomotives will be adopted more broadly, possibly impacting other rail transportation routes to key markets and ports, such as those in the Pacific Northwest (PNW).
Figure 2 shows containerized and bulk shipments from those Western ports. California, Oregon, and Washington ports process millions of tons of bulk and containerized agricultural exports yearly. Any regulatory changes that affect the efficiency or cost of rail transportation to these ports would directly influence export volumes and logistics. More stringent emissions standards may not only increase the costs of shipping goods to these ports but also alter the logistical dynamics and decrease the competitiveness of American agricultural goods on the global market. In addition, this would likely also impact the sourcing of agricultural and food companies operating in California, putting additional strain on the already struggling California ports.
Figure 2. Containerized and Bulk Shipments of Farm and Food Products from West Coast Ports
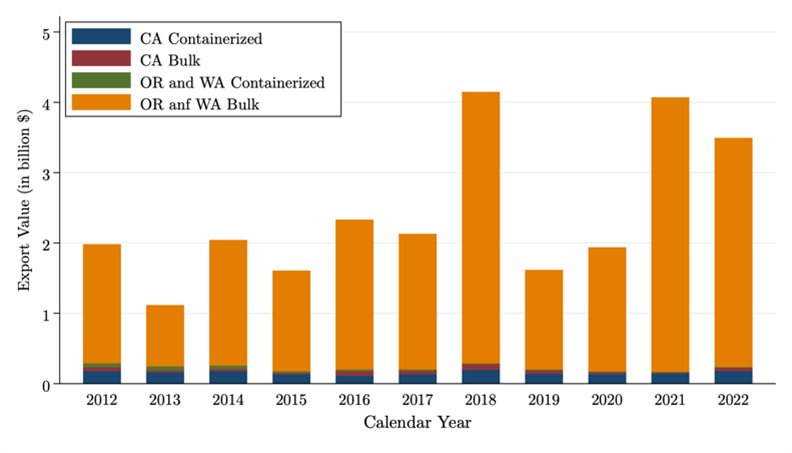
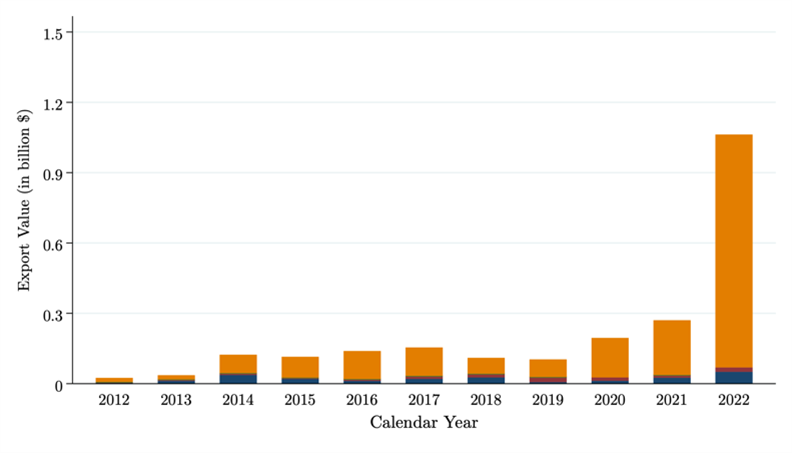
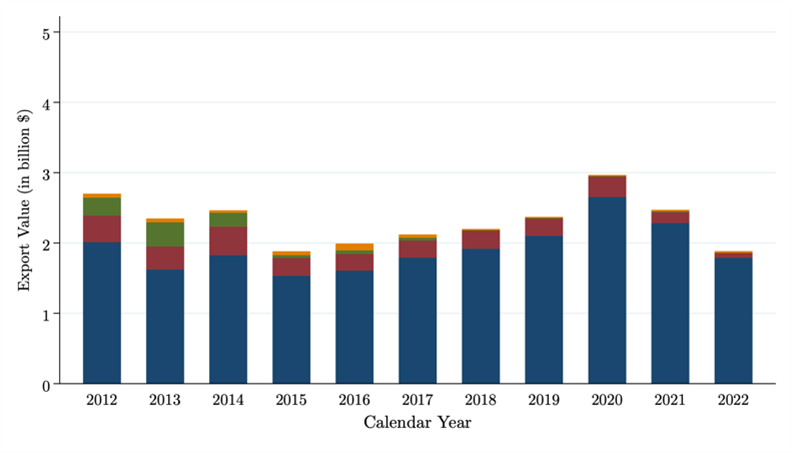
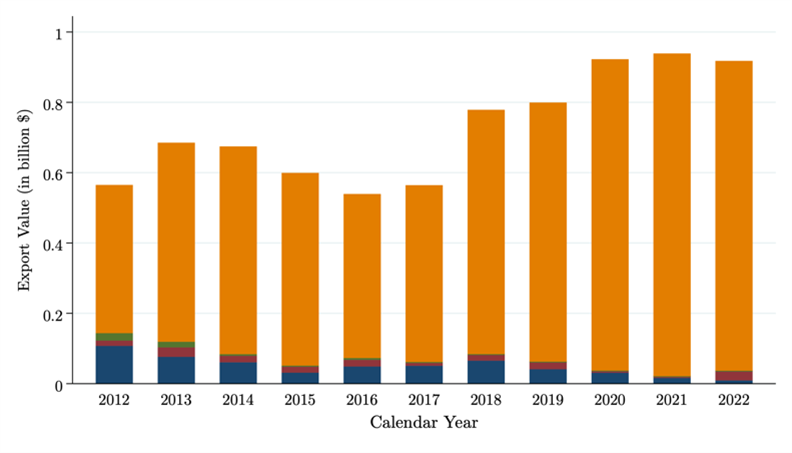
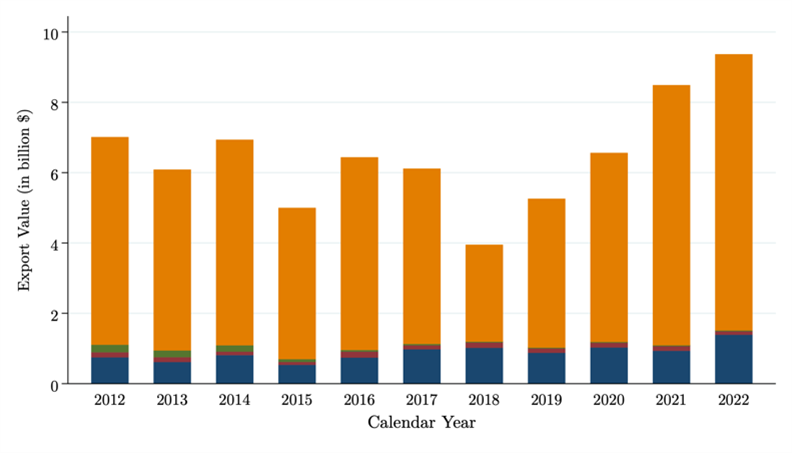
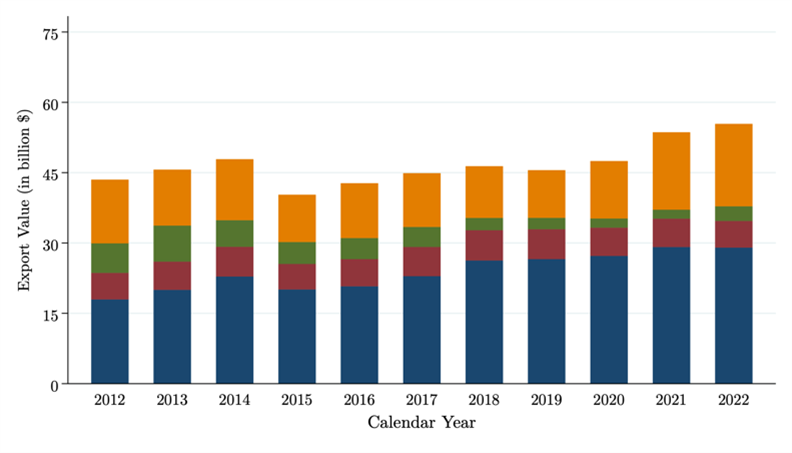
Note: The figure shows containerized and bulk shipments of farm and food products from West Coast ports from 2012 to 2022. Port-level shipment data was obtained from the U.S. Census Bureau (2024). The Harmonized System (HS) trade dataset was used to identify shipments from the Los Angeles, San Diego, and San Francisco port districts for California, the Columbia-Snake port district for Oregon, and the Seattle port district for Washington, respectively. Corn includes HS code 1005; other feed grains HS codes 1003, 1004, and 1007; pork and pork products HS code 0203; soybean meal HS code 120810; soybeans HS code 1201; and farm and food products HS chapters 1 to 24, respectively. All export values are expressed in million $. The legend is provided in sub-figure (a).
As a result, Midwest agricultural exporters may need to reevaluate transportation strategies more broadly. For instance, shifting traffic to road transport could increase congestion and associated costs, given that nearly 30 percent of Midwest agricultural products are transported to West Coast ports by rail. Using Gulf ports via the Mississippi barge system is another export route to Asia. However, this would add further demands on the river transportation system on top of its already aging infrastructure and drought concerns. Furthermore, this option is not cost-effective for farmers in the Upper Midwest who rely on rail access to the PNW for cost-effective access to Asian markets. Alternatively, significant investments in rail infrastructure to meet new standards could strain financial resources but potentially streamline cross-state rail operations in the long term.
Conclusion
The CARB locomotive regulation is not the first instance of California state regulations that have impacted agricultural producers in other U.S. states. Proposition 2 (free-range eggs) and Proposition 12 (sow farrowing crates) requirements have both resulted in changes to agricultural production practices beyond California’s borders. Still, in those cases, costs have fallen mainly on California consumers (Mullaly and Lusk 2018, Hawkins et al. 2024). California is now proposing a change to locomotives operating in the state with uncertainty regarding railroad operational changes and the scope of potential impacts. Our analysis of rail and export data indicates the high dependence of Midwest agriculture upon rail lines heading to West Coast states. Ten percent of total Midwest soybean meal and meat and meat products from the Midwest are shipped to California. The broader West Coast, including the PNW, accounts for 30 percent of farm and food products shipped out of the Midwest. This high dependence on cost-efficient rail transportation underscores the potential significance of this regulatory change. The California regulation may increase the cost of rail transportation, resulting in lower prices for agricultural producers and higher costs to their customers, which would affect farm income and export competitiveness and may carry global food security implications. Future research could include quantifying the economic impacts of the regulation under different scenarios (only California, adopted by more U.S. states) to assess how commodity and food prices, trade, and farm income may be affected.
Disclaimer
[1] The findings and conclusions in this article are those of the authors and do not represent the U.S. Department of Agriculture.References
CARB, 2024. Locomotive Fact Sheets. Last accessed: May 27, 2024, https://ww2.arb.ca.gov/our-work/programs/reducing-rail-emissions-california/locomotive-fact-sheets
EPA, 2024. California State Nonroad Engine Pollution Control Standards; In-Use Locomotive Regulation; Requests for Authorization; Opportunity for Public Hearing and Comment. Last accessed: May 27, 2024, https://www.regulations.gov/document/EPA-HQ-OAR-2023-0574-0001
FAOSTAT, 2024. Producer Price Index. Last accessed: May 25, 2024, https://openknowledge.fao.org/items/379338fc-c7d9-41a7-a44a-4c6797455f29
Hawkins, H., Arita, S. & Meyer, S., 2024. Proposition 12 Pork Retail Price Impacts on California Consumers. ARE Update 27(3): 5-8. https://s.giannini.ucop.edu/uploads/pub/2024/03/19/v27n3_2_e40mBEN.pdf
IICCA, 1995, ICC Termination Act of 1995. Last accessed: June 16, 2024, https://www.congress.gov/bill/104th-congress/house-bill/2539.
Mullally, C., & Lusk, J. L., 2018. The impact of farm animal housing restrictions on egg prices, consumer welfare, and production in California. American Journal of Agricultural Economics, 100(3), 649-669. https://doi.org/10.1093/ajae/aax049
Surface Transportation Board, 2024. Carload Waybill Sample. Last accessed: May 25, 2024, https://www.stb.gov/reports-data/waybill/
U.S. Census Bureau, 2024. HS Port-level Data. Last accessed: May 25, 2024, https://usatrade.census.gov
U.S. Department of Agriculture, 2024. State Agricultural Trade Data. Last accessed: May 26, 2024, https://www.ers.usda.gov/data-products/state-agricultural-trade-data/state-agricultural-trade-data/#CashR
Disclaimer: We request all readers, electronic media and others follow our citation guidelines when re-posting articles from farmdoc daily. Guidelines are available here. The farmdoc daily website falls under University of Illinois copyright and intellectual property rights. For a detailed statement, please see the University of Illinois Copyright Information and Policies here.