


Post-Harvest Grain Marketing in a Low-Price Environment
In the summer of 2024, two big price changes occurred in corn and soybean markets. First, price levels declined, beginning in June and continuing to the present. Figure 1 shows new-crop corn and soybean futures for delivery during the upcoming fall harvest period (the December 2024 corn and November 2024 soybean contracts) both fell by about 20% between the last week of May and late August.

The second big change over the same May to August period was the increase in calendar spreads, the difference between the price for delivery in early 2025 to the fall 2024 harvest-time price. Figure 2 shows the spread between March 2025 and harvest-time contracts roughly tripled for soybeans and doubled for corn. While the increase in soybean spreads was concurrent to the price decline, corn spreads only really began to increase in late June. This article discusses the implications of larger spreads for commodity marketing in the post-harvest period.
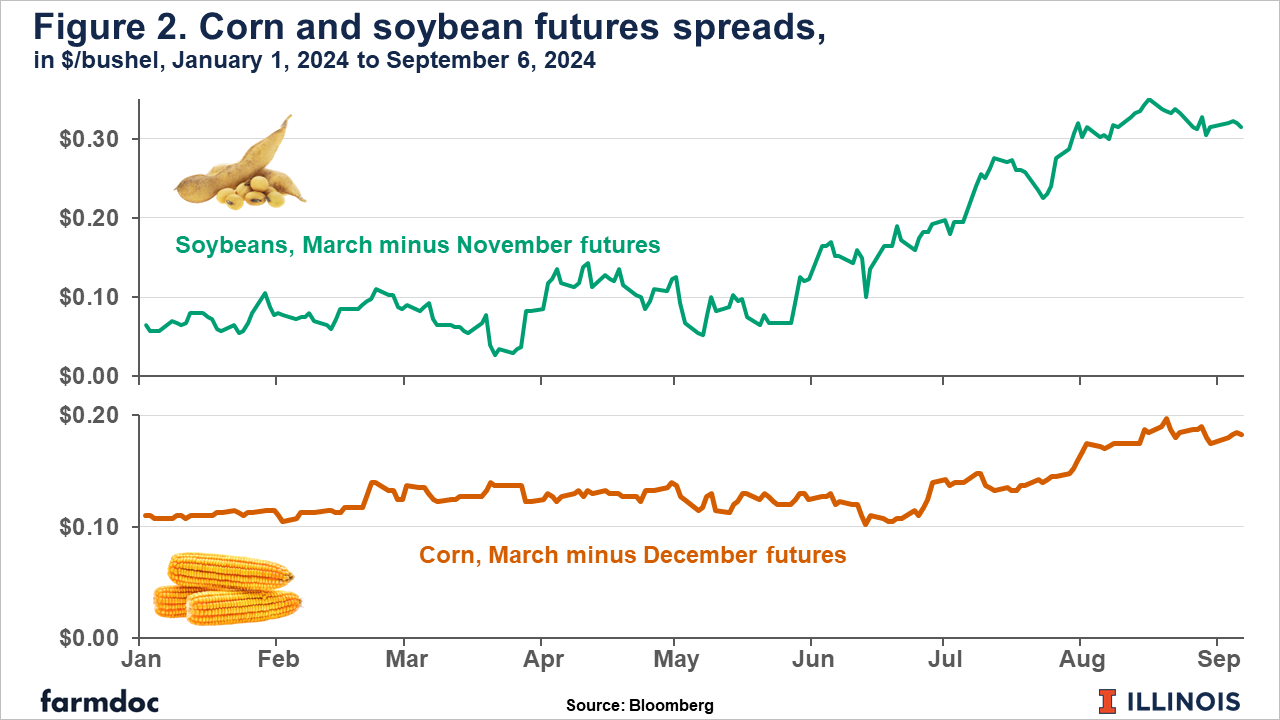
The explanation for lower prices and larger spreads is straightforward. The market will be adequately supplied in the near term. The coming US corn and soybean crop is expected to be historically large. No substantive new demand has emerged to meet this increase in supply. As such, spreads must rise so futures markets may perform one of their principal functions, allocating grain that is abundant now to post-harvest time periods where it is less so by incentivizing enough storage. The spread is commonly called the ‘carry’, since it represents the return to the act of ‘carrying’ or storing the grain over time.
Evaluating Current Futures Spreads
What do larger spreads mean? It helps to first understand what they are not. Positive carry observed in the futures market today should not be viewed as a guarantee of better prices later in the marketing year (relative to prices at harvest). There is continued fundamental price risk. For instance, March 2025 corn prices may be as likely to be below the current $4.25/bushel price as above it.
Instead of a forecast, futures spreads provide a guaranteed return for those willing to hold the commodity to that later date relative to what could be earned for selling for near-term delivery. The carry is what the market offers to those who would commit to providing the service of storing grain from now until a given future date. A common adage is that ‘you can’t capture the carry unless you sell the carry’, that is the revenue is not guaranteed unless a sale for deferred delivery is made. The alternative, holding unpriced grain in storage, is simply speculating on the prospect that the commodity will be worth more in the future than the current price. This article offers no analysis relevant to the decision to hold unpriced grain in storage after harvest in 2024 or at any other time.
The decision to sell the carry or take the price given by the market at harvest must be evaluated relative to the costs of storage. These costs can generally be divided into two types: physical costs related to the handling, maintenance, and insurance of physical crop inventories, and the opportunity cost of giving up revenue from grain sales at harvest in favor of a higher price later. Note these costs of storage are incurred whether the commodity holder captures the carry or is speculating on unpriced inventory.
Table 1 provides a simple evaluation of the per-bushel profitability of corn and soybean storage given current futures spreads. The profit calculation is simply the price spread between two delivery dates (after and at harvest) less the assumed physical and opportunity costs of storage over the same period (explained further below). Note that per-bushel costs may vary more widely among different farm and commercial storers than is noted in Table 1. Even within a given business, the cost of storage may vary substantially with the quantity stored.
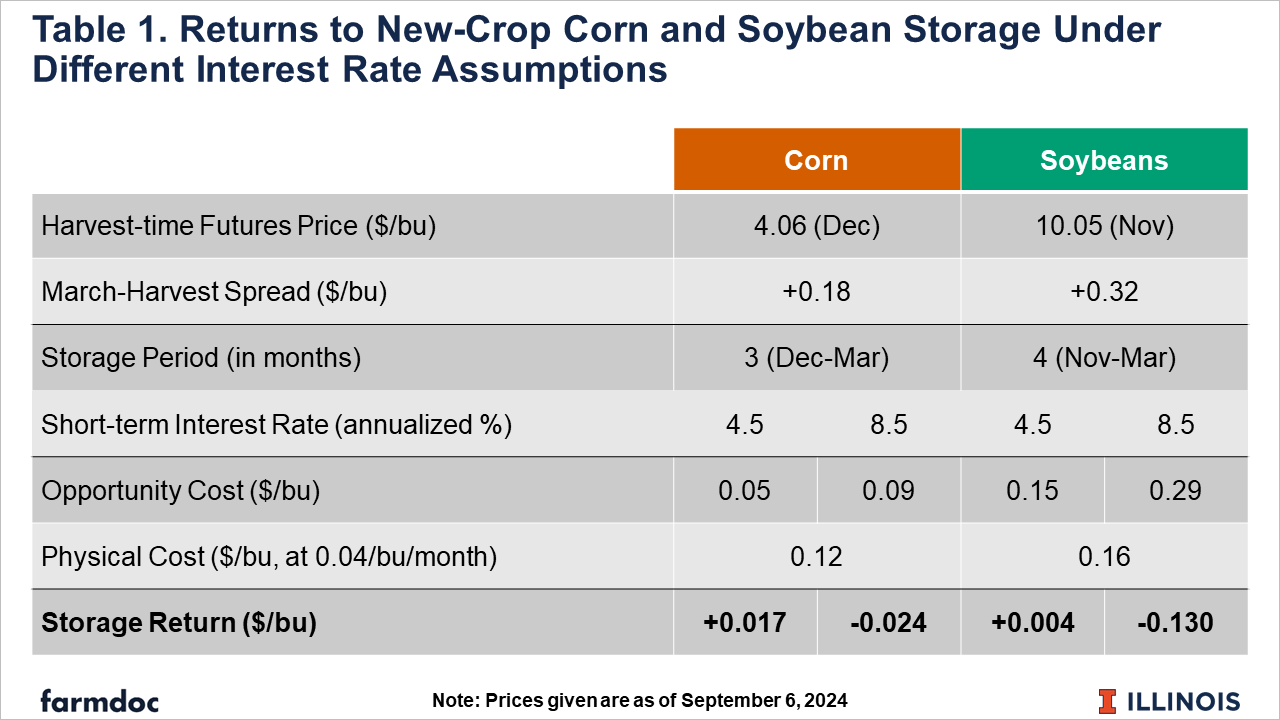
In Table 1, physical storage costs are based on a rate of four cents per bushel per month, which roughly approximates the current price charged to farmers by commercial elevators for storage in the Corn Belt, excluding additional fees or in-charges. Opportunity costs are based on two scenarios for the interest rate used to value foregone revenue (that is the current price for harvest delivery). The lower rate is 4.5%, roughly equal to the current return on high-yielding savings accounts. The implicit assumption here is that foregone revenue has no higher return than simply putting it in the bank. The higher rate is 8.5%, or roughly the current interest rate on new farm operating loans according to data from the Federal Reserve Bank of Chicago. The implicit assumption in this case is that foregone revenue could have been used to pay down operating loan debt.
These calculations suggest current spreads provide positive profit from storing for both corn and soybeans, but only if the estimated opportunity cost is relatively low. Under low opportunity cost assumption (interest rate is 4.5%), storers cover both physical and opportunity costs, penciling out a small profit of roughly two cents per bushel for corn and half a cent per bushel for soybeans. Under the high opportunity cost assumption, physical costs would need to be roughly one cent per bushel per month lower for corn and about three cents lower for soybeans for the current spread to cover all storage costs. This difference highlights how opportunity costs of storage are larger for soybeans than for corn on a per-bushel basis due to the higher per-bushel value of soybeans.
Implications
The analysis above provides a starting point for post-harvest marketing discussions about which crop gets stored first at harvest and which farms, commercial elevators, and locations are more likely to store than others. Notice that the physical costs of storage are essentially the same on a per-bushel/per-month basis. Commercial grain storage rates typically reflect roughly similar cost of a bushel of grain occupying what may be scarce storage space. However, opportunity costs vary substantially between corn and soybeans. While larger spreads in the soybean market make up some of this difference, they do not equilibrate the returns to storage among crops under current market conditions.
When should a farm or other commercial firm in the grain supply chain store corn or soybeans? Obviously, one time is when the firm wants to speculate on the future value of the commodity. As noted above, corn and soybean prices are now lower than past values, but this article provides no guidance on the likelihood of higher prices in the coming marketing year.
Profitable storage generally happens when the firm has available capacity both in terms of its physical space and financial ability to defer revenue. This capacity is greater for small quantities of storage; physical storage costs grow as storage space becomes scarce or storage and handling infrastructure becomes constrained. The logistics of crop movement at and after harvest may also play a role in storage decisions but these are difficult to quantify on a per-bushel basis like the calculations in Table 1.
The economics of the sell-versus store decision can be continuously monitored and evaluated. Changing market conditions affect the profitability of storage. Later this week, the USDA’s September WASDE report may adjust the production and use projections. Perhaps more consequential for storage and post-harvest grain marketing will be the September 30 Grain Stocks report, where USDA will provide estimates for corn and soybean inventories as of September 1, the end of the 2023/24 marketing year and the beginning of the 2024/25 marketing year. The stocks report will provide an assessment of how old-crop grain stocks were drawn down going into the new marketing year and whether significant stocks remain on-farm, occupying what is likely to be scarce physical storage capacity for the upcoming harvest.
References
USDA NASS. Crop Production Report. August 12, 2024. https://release.nass.usda.gov/reports/crop0824.pdf
Federal Reserve Bank of Chicago. AgConditions. August 15, 2024. https://www.chicagofed.org/research/data/ag-conditions/index
Disclaimer: We request all readers, electronic media and others follow our citation guidelines when re-posting articles from farmdoc daily. Guidelines are available here. The farmdoc daily website falls under University of Illinois copyright and intellectual property rights. For a detailed statement, please see the University of Illinois Copyright Information and Policies here.