


2011 Corn and Soybean Yields in Perspective
Corn and soybean yields in 2011 exhibited variation across Illinois and the Midwest. For corn, some counties in northern Illinois had yields above trend yields, but most of the central and southern Illinois counties had yields below trend. For soybeans, northern Illinois counties had above trend yields while many central and southern counties had yields below trend. Over the Midwest, there also was variation in yields.
In this post, 2011 county yields are compared to trend yields. Trend yields were found using county yield data from 1972 to 2010. Straight lines related to time were fit through this historical data using linear regression methods. Then, 2011 trend yields were found by extending the line through 2011. These trend yields represent expected values for 2011. For example, Ford County, Illinois had a 2011 trend yield of 166 bushels per acre. Given ?normal? weather and other conditions, the yield in Ford County was expected to be 166 bushels in 2011. The actual 2011 yield in Ford County was 137 bushels per acre, and the deviation from trend was -29 bushels per acre. This means that Ford County?s yield was 29 bushels below the 2011 expected level. In the following maps, 2011 yields are stated as deviations from trend.
Corn Yields
Northern Illinois had better yields than central and southern Illinois. In northern Illinois, four counties had 2011 yields that were five bushels above trend yields: McHenry (17 bushel), Boone (15 bushels), Stephenson (8 bushels), and DeKalb counties (6 bushels).
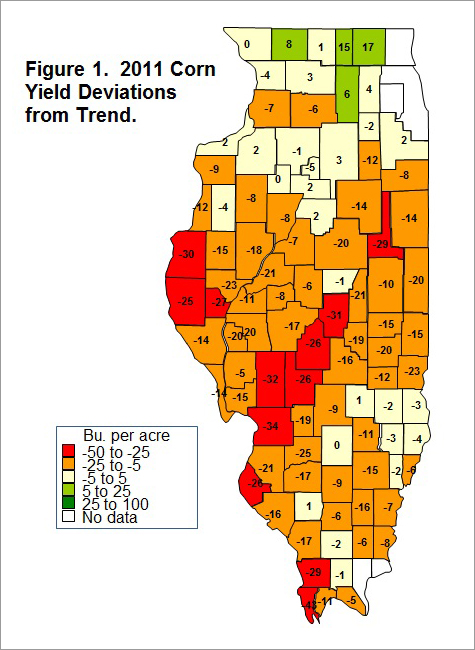
In southeast Illinois there was a pocket of counties that had counties within 5 bushels of trend: Effingham (1 bushel), Jasper (-2 bushels), Crawford (-3 bushels), Richland (-3 bushels), Lawrence (-4 bushels), and Edwards Counties (-2 bushels). There also were scattered counties throughout Illinois that had 2011 yields near trend values.
Most central and southern Illinois counties had yields that were at least 5 bushels below trend yields. There were twelve counties that had trend yields that were more than 25 bushels below trend. In relation to trend yields, the five worst yielding counties were Alexander (-43 bushels below trend), Madison (-34 bushels), Macoupin (-32 bushels), Macon (-31 bushels), and Hancock counties (-30 bushels).
Corn yields were below trend over much of Illinois. Other Midwest area were trend were low included Indiana, southern Iowa, central Minnesota, eastern North Dakota, northwest South Dakota, and western Nebraska (see Figure 2). Above trend yields were in Ohio, Michigan, northeast Iowa, Wisconsin, western North Dakota, western South Dakota, and Eastern Nebraska.

Soybean Yields
Soybean yields varied across Illinois (see Figure 3). Many counties in the northern one-third of Illinois had yields above trend. Twelve counties in northern Illinois had 2011 ten bushels higher than trend. Compared to trend yield, the highest yielding counties were Boone (10 bushel above trend), La Salle (9 bushels), Ogle (8 bushels) and Henry (8 bushels). Six counties had county yield 7 bushels above trend: Lee, Kane, Knox, DeKalb, Rock Island, and Stephenson counties.
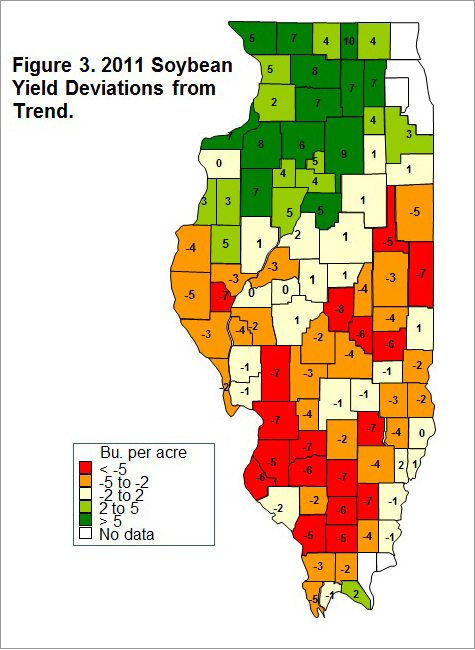
Many counties in central and southern Illinois had yields below trend. Compared to trend, the worst yielding county was Macon, with actual yield 8 bushels below trend. Eight counties had actual yields 7 bushels below trend: Brown, Clay, Clinton, Hamilton, Jefferson, Macoupin, Madison, and Vermilion counties.
Variations in yields existed across Illinois. The same is true for the Midwest (see figure 4). Below trend yields were experienced in central and southern Illinois, Indiana, Minnesota, North Dakota, and eastern South Dakota. Above trend yields occurred in eastern Iowa and northern Illinois, eastern Nebraska, Ohio, and Michigan.

Summary
Overall, 2011 was a mixed year for yields, with some areas having yields significantly below trend while other areas having yields above trend. Generally, mixed yields across the Midwest lead to national per acre yields at or below trend. Both the national per acre yields for corn and soybeans was below trend in 2011. To have high national yields, generally only a very limited area can have poor yields.
Perhaps the biggest surprise is Ohio and Michigan, which had above trend yields. The eastern corn-belt had a difficult planting period in 2011. However, summer weather was conducive to good yields in Ohio and Michigan. These above average yields in Ohio and Michigan again confirm the importance of mid-summer weather in determining yields.
Disclaimer: We request all readers, electronic media and others follow our citation guidelines when re-posting articles from farmdoc daily. Guidelines are available here. The farmdoc daily website falls under University of Illinois copyright and intellectual property rights. For a detailed statement, please see the University of Illinois Copyright Information and Policies here.