


ARC and Multi-Year Price Declines
The Senate Agriculture Committee recently passed a version of the Farm Bill that now moves for debate in the entire Senate. This Bill replaces direct, counter-cyclical, and SURE payments with Agricultural Risk Coverage (ARC), a revenue-based program that is further described in yesterday’s post by Carl Zulauf (see here). In today’s post, ARC payments are computed for cases in which prices are low for several years. This emphasis is taken as ARC is specifically designed to provide protection in cases of multi-year revenue losses, cases in in which crop insurance often provides limited protection. ARC payments are computed for corn in Champaign County, Illinois, as further described in the next section.
County ARC Example
If ARC comes into existence, farmers will make a choice between using either 1) county yields or 2) individual farm yields. This selection is made at the beginning of the Farm Bill and is scheduled to be applicable for marketing years 2013 through 2017. Calculations for county ARC are illustrated below. Difference between the county and farm program then are outlined in the following subsection.
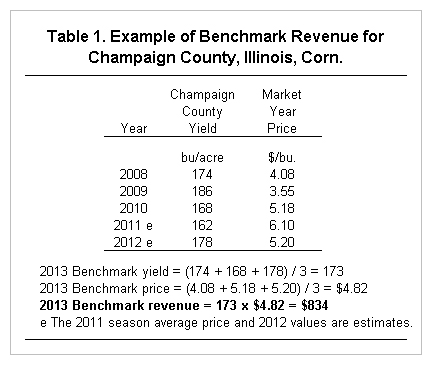
ARC’s guarantee is based on benchmark revenue. Benchmark revenue equals the five-year Olympic average of county yields times the five-year Olympic average of national, crop marketing year prices. An example of benchmark revenue calculation is shown in Table 1 for corn in Champaign County, Illinois. In this example, 2013 benchmark revenue is calculated with estimates of 2012 county yield and 2102 national price. Based on historical yields, the 2013 Olympic average yield is 173 bushels per acre (see Table 1). An Olympic average is found by eliminating the highest and lowest yields, and averaging the remaining yields. The 173 bushel average results from averaging the 2008 yield of 174 bushels per acre, the 2010 yield of 168 bushels per acre, and the 2012 estimated yield of 178 bushels per acre. The 2013 Olympic average price is $4.82 per bushel. Multiplying 173 bushels by the $4.82 per bushel price gives benchmark revenue of $834 per acre.
Payments will occur when 2013 actual revenue is below .89 times benchmark revenue. Effectively, ARC offers an 89% coverage level on benchmark revenue. For the Champaign County example, payments will occur when actual revenue is below $742 per acre (.89 x $834 benchmark revenue). Actual revenue is calculated by multiplying county yield times the first five-months of national prices. If 2013 actual revenue is $700, an ARC payment is based on a $42 shortfall ($742 – $700 actual revenue). The maximum shortfall that can be paid on is 10% of benchmark revenue. Effectively, ARC provides protection for a band between 89% and 79% of benchmark revenue. In the Champaign County example, the maximum shortfall is $83 per acre (.10 x $834 benchmark revenue).
Per acre payment are based on the shortfall times a factor. The factor is .80 for planted acres and .45 for prevented planted acres. Use of these factors effectively causes ARC to only cover a portion of losses between .89 and .79 of benchmark revenue. For a planted acre, the ARC payment on a $42 per acre shortfall is $34 per acre (.8 x $42). Payments would be received on planted acres, with a limit that planted acres for all crops cannot exceed average plantings from 2008 through 2012.
Individual ARC
Individual ARC functions like county ARC except:
- Farm yields are used in calculating benchmark and actual revenue
- The planted acre factor used to multiply a shortfall is .65 rather than .8 for county ARC.
The lower payment factor is designed to equalize payment of county ARC and farm ARC across the United States. At the same payment rate, farm ARC would make more payments than county ARC because farm yields are more variable than county yields.
Lower Prices and County ARC Payments
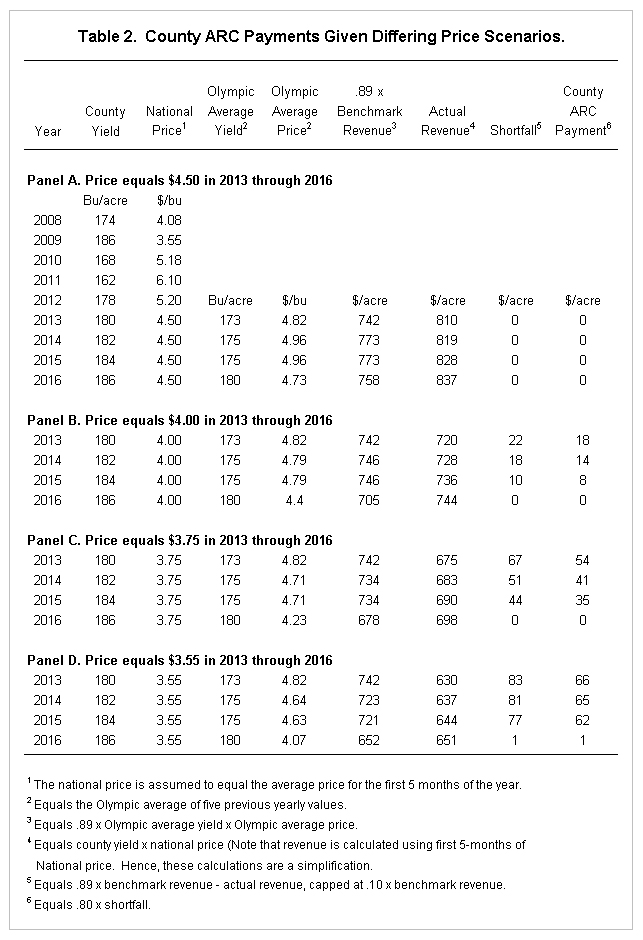
ARC is designed to protect against multi-year revenue declines, as these would not be covered by crop insurance. An example is for lower prices that occur across years. Impacts of lower prices are examined in Table 2 for the Champaign County example. In this example, county ARC payments are calculated for 2013 through 2016 with county yields growing at trend rate of two bushels per year (180 bushels in 2013, 182 bushels in 2014, and etc.). The same price in 2013 through 2016 is used to calculate county ARC payments. For example, Panel A has a $4.50 price in each year from 2013 to 2016. In the examples, the national price for the entire year is assumed to equal the average of the first five months of the marketing year.
A number of studies suggest that corn prices will average $4.50 over time (see here). A $4.50 price is below recent national prices of $5.18 for 2011 and an estimated $6.10 for 2012. A price of $4.50 from 2013 through 2016 would not generate county ARC payments, given that county yields are near expectations (see Panel A of Table 2) Hence, price near long-run prices would not generate ARC payments unless county yields decline by more than 11%. Before an ARC payment would be generated in 2013, price would have to be below $4.12 per bushel.
A price of $4.00 generates a county ARC payment of $18 per acre in 2013, $14 in 2014, $8 in 2015, and $0 in 2016 (see Panel B). ARC payments decline over time as lower prices enter into the benchmark revenue. The Olympic price declines from $4.82 in 2012 to $4.40 in 2016
A price of $3.75 is a relatively low price. During the late 1990s, actual prices were 15 to 20 percent below the long-run average price. A $3.75 price is 16% below the estimated long-run price of $4.50. Hence, this example replicates late 1990 conditions. Historical deviations suggest that this price or lower could occur in roughly 25 percent of the years (see here). A stable $3.75 price generates a per acre county payment of $54 per acre in 2013, $41 in 2014, $35 in 2015, and $0 in 2015. These payments would partially offset a decline in revenue from lower prices that lasts over multiple years. For example, a $3.75 price would generate $135 lower revenue than if a $4.50 price is realized (-$135 = ($3.75 – $.450) x 180 bushels per acre).
In 2009, the National price was $3.55 per bushel. Historical deviations suggest this price or lower could happen in 10 percent of years. A price of $3.55 for several years would be rare. Not that this $3.55 price is considerably above the $1.95 loan rate, suggesting that this loan deficiency payments would not occur. A series of $3.55 per bushel prices would generate ARC payments of $66 per acre in 2013, $65 in 2014, $62 in 2015, and $1 in 2016. Again, county ARC payments would partially cover revenue declines. ARC payments will decline over time as lower prices enter into the calculation of benchmark revenue.
Payments in the above example depend on yields. In Illinois, there is a negative correlation between yields and prices. It could be argued that lower prices in the examples in Panel B through D would be accompanied by much higher yields, as higher yields would lead to more supply and lower prices. Higher yields would lower payments shown in Table 2.
Summary
ARC will make payments if revenues reach lower levels. In years in which revenue declines, ARC payments will be useful to farmers.
ARC payments will offset some of the losses in gross revenue. The entire loss will not be covered because 1) the .89 factor used to calculate the guarantee effectively puts an 11% deductible on revenue losses, 2) payments are a factor of the shortfall (.80 for the county program and .65 for the farm program), and 3) ARC payments are capped at 10% of benchmark revenue.
If prices are persistently low for several years, ARC payments will decline over time as lower prices enter into the calculation of benchmark revenue. Hence, ARC will provide payments in early years of a multi-year price decline, eventually though farmers will need to fully adjust to price declines as ARC payment decline.
Disclaimer: We request all readers, electronic media and others follow our citation guidelines when re-posting articles from farmdoc daily. Guidelines are available here. The farmdoc daily website falls under University of Illinois copyright and intellectual property rights. For a detailed statement, please see the University of Illinois Copyright Information and Policies here.