


Release of 2013 ACRE Payment Estimator
The 2013 ACRE Payment Estimator is a FAST Excel spreadsheet that provides an evaluation of payments from the Average Crop Revenue Election (ACRE) program for the 2013 marketing year. This program provides state and crop specific estimates of price and yields under which ACRE will make payments. It also estimates the percent of time ACRE will pay and estimates the expected payments from ACRE. The Excel spreadsheet can be downloaded here.
The ACRE Election
More detail on the ACRE election is provided here and here. In essence, farmers and landowners have until June 3, 2013 to enroll Farm Service Agency (FSA) farms into ACRE. Previous ACRE elections do not matter. Farm Service Agency (FSA) farms in the 2012 ACRE program can either be or not be enrolled in the 2013 program. Similarly, FSA farms not enrolled in the 2012 ACRE can either be or not be enrolled in the 2013 ACRE program.
Enrolling a FSA farm in ACRE will:
- Reduce direct payments by 20%. Whether in or out of ACRE, the 2013 direct payment will be reduced from 2012 levels due to Federal budget sequestration. This reduction is scheduled to be 8.5%. If a farm had a $25 direct payment in 2012, the direct payment in 2013 given that the farm is not enrolled in ACRE will be $22.88 ($25 direct payment x (1 – .085 reduction)). Enrolling in ACRE will further reduce the direct payment by $4.58 ($22.88 x .20 reduction). Most Illinois farms will have direct payments reduced by $3.50 to $5.00 per acre by enrolling in ACRE.
- Reduce loan rates by 30%. Loan deficiency payments are unlikely as market prices are well above loan rates. National loan rates are $1.95 for corn, $5.00 for soybeans, and $2.94 for wheat. Reducing these loan rates by a further 30% make LDP and marketing loans very unlikely. However, the 30% reduction may be important to those farmers who take out marketing loans on stored grain, as loans will be reduced by 30% when an FSA farm is enrolled in ACRE.
- Replace the counter-cyclical program with the ACRE program. The counter-cyclical program makes payments when market year average prices are bellow “trigger” prices. Trigger price are $2.35 for corn, $5.56 for soybeans, and $3.65 for wheat. MYA prices are not likely to be below these prices.
In most case the tradeoff between enrolling in the ACRE program is giving up $3.50 to $5.00 per acre of direct payments for the chance of ACRE payments in cases of low state revenues.
2013 State ACRE Payment Estimator by Crop
This Microsoft Excel spreadsheet will provide information useful in judging the conditions under which ACRE will make payments. Users of the tool will first choose a state (see Figure 1). Then the tool will give per acre benchmarks for corn, soybeans, and wheat. In the example for Illinois in Figure 1, the final benchmarks are $776 per acre for corn, $535 per acre for soybeans, and $352 per acre for wheat. A couple notes about the benchmarks:
- Under ACRE, a preliminary benchmark is calculated which equals 90% of a benchmark price times a benchmark yield. The preliminary benchmark then is compared to last years’ benchmark. The benchmark cannot change by more than 10% from one year to next. Almost always, the 2013 final benchmarks will be limited by the 2012 benchmark, and increase by 10% from the 2012 benchmark.
- The tool allows 2012 market year average (MYA) prices to be changed. The 2012 MYA price influences the benchmark price that is used to calculate the preliminary benchmark. Because of the 10% movement limit from one year to the next, 2012 MYA prices have no impact on final benchmarks in many cases.
- Some states have benchmarks for irrigated and non-irrigated farmland. For those states, there will be a choice in the “Type” input (see Figure 1). If irrigated versus non-irrigated land is not an option, “Type” will be limited to an “All” choice.
- This program has a database of benchmark yields. Benchmark yields are an Olympic average of the previous five years of state yields. At this point, the 2012 yields are not final. Hence the benchmark yields are not final. When these yields are finalized this tool will be updated. It is not likely that these revisions will have much impact on results from this program.

2013 State Acre Payments x .85
The ACRE Payment Estimator then provides a table of state ACRE payments times .85 for different state yields and MYA prices. Figure 2 shows an example of this table for corn in Illinois. Users can also receive tables for soybeans and wheat by changing the crop selection.
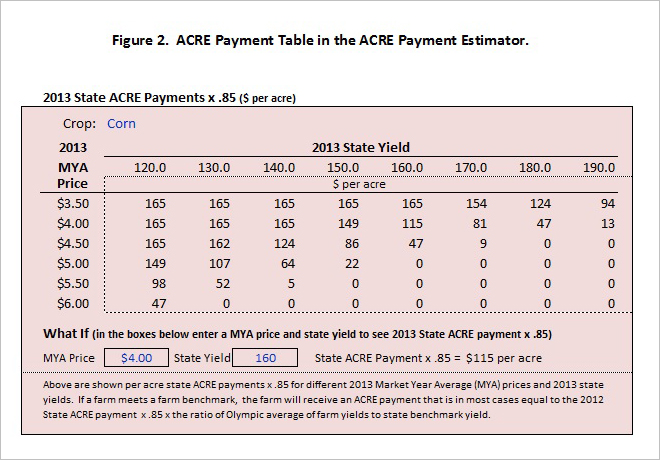
This program gives state ACRE payments times .85. Given that a farm benchmark is met, payments that farmers will receive equal:
- State ACRE payment x .85 x 5-year Olympic average farm yields / benchmark state yield
where the benchmark state yield is given in Figure 1. By multiplying the state ACRE payment times .85, payments closer to what farmers receive are given. Each farmer then can multiply payments in Figure 2 by the ratio of farm yields to benchmark state yields. Farms with higher yields than the state average will receive higher payments and vice versa. Before an ACRE payment is received, a farm benchmark must also be met. More detail is provided here.
The table in Figure 2 provides indications in when ACRE pays. The benchmark yield for corn in Illinois is 162 bushels per acre (see figure 1). If Illinois averages 170 bushels per acre, representing a yield slightly above average, ACRE payments occur for prices below $4.50: The state ACRE payment times .85 is $9.00 per acre for a $4.50 MYA price, $81 per acre for a $4.00 MYA price, and $154 for a $3.50 price (see Figure 2). ACRE will provide protection against low prices given average or above yields.
The 2013 ACRE Payment Estimator also includes a “What If” capability. Users can enter a MYA price and state yield to determine the state ACRE payment. In the example shown in Figure 2, the MYA price is $4.00, the state yields is 160 bushel, giving a state ACRE payment times .85 of $115 per acre.
2013 Estimated Payments
The program also estimates the times ACRE pays and the average ACRE payment (see Figure 3). These results are based on a simulation model that uses historical prices and yields, calibrated to today’s conditions.
Figure 3 shows results for Illinois. For corn, there is a 27% chance of an ACRE payment in 2013. This means that 73% of the time ACRE will not make a payment for corn in Illinois in 2013. The average state ACRE payment (x .85) is $13 per acre. There is a distribution around the $13 payment. Seventy-three percent of the time the ACRE payment will be $0 per acre. The remaining 27% of payments result in an average of $13 per acre.
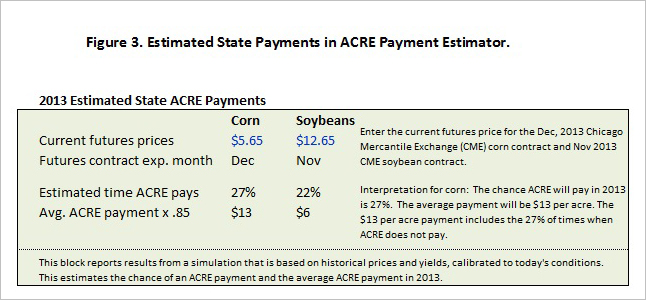
This simulation is calibrated to current futures price levels. Lower futures prices indicate lower expected 2013 MYA prices, leading to higher ACRE payments. Default futures prices in the model are 2013 projected prices used to set crop insurance guarantees.
Summary
The 2013 ACRE Payment Estimator will provide an evaluation of the likelihood and size of ACRE payments. In most Midwest cases, expected ACRE payments are near what is given up in terms of direct payments. If protection is desired for low revenues, which may be caused by low prices, ACRE will be a suitable alternative.
Disclaimer: We request all readers, electronic media and others follow our citation guidelines when re-posting articles from farmdoc daily. Guidelines are available here. The farmdoc daily website falls under University of Illinois copyright and intellectual property rights. For a detailed statement, please see the University of Illinois Copyright Information and Policies here.