


Early Evidence on MPP-Dairy Participation Patterns
In January, USDA’s Farm Service Agency released a State-by-State 2015 Margin Protection Program Enrollment table. Highlights of the table include the percentage of farms enrolled in MPP-Dairy, and the percentage of enrolled dairy operations purchasing supplemental coverage above the minimum no-cost catastrophic coverage level ($4 per hundredweight).[1]
Today’s article takes a closer look at these data in order to provide early evidence on which farms signed up for MPP-Dairy. A key finding is that sign-up patterns are consistent with a fee structure that creates higher initial costs of participation for smaller farms, and higher buy-up costs for larger farms. This was not unexpected as the administrative fee was fixed at $100 and premiums were differentiated into two tiers such that total premiums costs were pro rata to the amount of milk covered under MPP-Dairy.[2]
To provide perspective on possible participation incentives we turn toward mid-December futures and options contracts to assemble information on the expected 2015 dairy margins, and thus expected MPP-Dairy payments, at the sign-up deadline (December 19, 2014). Using this information the expected returns from participation are presented for two representative dairy farms. Comparing the financial results with actual enrollment patterns provides some early evidence on how and why dairy farmers ultimately chose to participate in MPP-Dairy.
Who Signed Up for MPP-Dairy?
Nearly 24 thousand U.S. dairy producers signed up for MPP-Dairy in 2015. This total represents approximately 50% of the licensed dairy operations in 2013. To look at the farm structure of MPP-Dairy participants, we plot for each state the share of participating farms against milk production per registered dairy farm, a measure of average farm size.[3] Figure 1 shows that participation rate is positively correlated with farm size across states: the correlation coefficient is 0.35. The positive correlation suggests that participation in MPP-Dairy was higher in states where farms are larger. To participate in MPP-Dairy farmers must pay a fixed $100 administrative fee each year. A likely explanation, then, for higher participation rates in states with larger farms is that the average administrative fee is diminished considerably as more milk is enrolled in the program.

Farms seeking additional protection beyond the $4 coverage level may buy-up coverage between $4.50 and $8 per hundredweight. Farms electing coverage above $4 per hundredweight pay a per hundredweight premium that is increasing with the coverage level (i.e. lower for $4.50 coverage and higher for $8.00 coverage). The premiums are also higher for milk covered in excess of 4 million pounds of annual milk production (Table 1). Thus, a different pattern emerges when we evaluate participation in buy-up coverage by farm size (Figure 2).

Fifty-five percent of operations participating in MPP-Dairy elected to pay for coverage above the base $4 margin. Buy-up rates differed across states. As demonstrated in Figure 2 there is a negative relationship between average annual milk production and the percentage of participating farms with buy-up coverage. The correlation coefficient between these two measures is -0.41, indicating that MPP-Dairy participation at the buy-up levels was higher in states where the average annual milk production was lower.
For states with average annual milk production below 4 million pounds the buy-up rate was 52% of participating farms, and for states above 4 million pounds the buy-up rate was 36%. Thus it appears that the lower out-of-pocket premiums provided incentives to participate for farmers covering less than 4 million pounds of milk.
It is worth noting that larger farms could minimize exposure to the higher buy-up premiums by lowering the coverage percentage in order to get closer to the 4 million pound threshold. However information on coverage rates of participating farms is unavailable so it is not clear whether farmers pursued such a strategy.
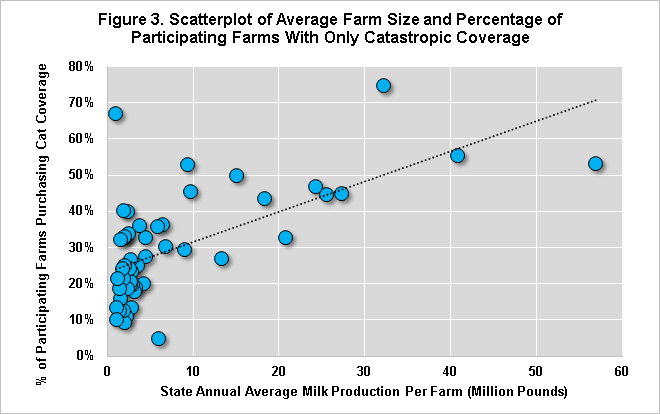
The corollary to larger participating farms foregoing buy-up MPP-Dairy coverage due to higher premiums is that these same farms opted for the minimum $4 coverage. Participation at $4 coverage carries only the $100 administrative fee and provides protection against severe declines in the MPP-Dairy margin. Figure 3 confirms that there is a strong positive correlation (0.63) between average annual milk production and the percentage of farms with only $4 coverage.
Financial Incentives to Participate
To further illustrate how premium costs may have affected MPP-Dairy participation, we calculated expected returns to MPP-Dairy participation for two hypothetical farms. Using futures prices on December 19, 2014 (the sign-up deadline) to forecast the expected MPP-Dairy margin for the 2015 calendar year, we calculated returns to participation at alternative coverage levels for a farm covering 4 million pounds and a farm covering 20 million pounds (Table 1). For the farm covering 4 million pounds, all MPP-Dairy coverage options above $5.00 per hundredweight had positive net expected benefits, and net expected benefits for these farms was highest under $7.50 coverage at $0.159 per hundredweight. Meanwhile, $6.50 coverage, at one-third of the price of $7.50 coverage, had expected benefits of $0.069 per hundredweight. Even though $4 coverage carried no premium, the $100 administrative fee combined with a low probability of pay-out resulted in negative net expected benefits.
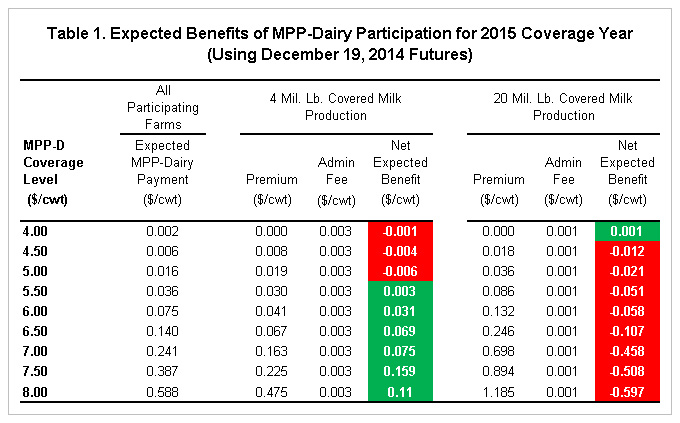
For the farm covering 20 million pounds of milk, higher buy-up premiums resulted in negative expected net benefits for all buy-up coverage options. For example, $8 coverage would have cost $1.185 per hundredweight and had gross expected payments of only $0.588 per hundredweight. However, unlike the smaller farm, the larger farm had positive expected net benefits at the minimum $4 coverage due to the lower per hundredweight value of the administrative fee.
Aside from the expected payouts, farms of all sizes may have had alternative incentives to participate in 2015. First, USDA implementation rules stipulate that only dairy farmers enrolled in the program are eligible for production history increases in subsequent coverage years. With U.S. milk production growing by 2.4% in 2014, production history increases could be well worth the $100 administrative fee for larger dairy operations. Second, risk-averse farmers may be willing to accept low or even negative expected payouts in order to insure against catastrophic declines in farm income.
Summary
To summarize, the participation pattern that we observe is consistent with farms responding to incentives created by the financial participation costs. The fixed $100 administration fee is relatively small for larger farms, so we see higher participation rates in states with larger farms. After the initial administrative fee, premiums for buy-up coverage are lower for milk covered at or below 4 million pounds, so we see greater use of buy-up coverage in states with smaller farms. Lastly, premiums for buy-up coverage are higher for milk covered in excess of 4 million pounds, so we see more use of the basic $4 coverage in lieu of buy-up coverage in states with larger farms.
The results are suggestive of likely participation patterns and motivations. There are other factors that may affect sign-up that we are not considering here, as well as unexplained variation around the patterns we highlight here. More analysis is needed to explore the characteristics of participants and non-participants, and to better understand the sign-up decisions (how much milk to cover and at what margin) of participating farms.
It’s worth mentioning that a couple factors might have contributed to the observed participation rate. First, during much of the sign-up period (September 2 to December 19) the USDA all-milk price was only just beginning to retreat from the record highs of 2014 and the futures curve on Class III milk had yet to fall below $14 per hundredweight in nearby months. Market price expectations for dairy, combined with lower feed prices, led to a low probability of MPP-Dairy benefits for most of the MPP-Dairy coverage options. Supporting market price projections, USDA price forecasts and research-based price forecasts were mostly neutral in terms of MPP-Dairy margin severity. It was only in the weeks prior to the sign-up deadline did milk prices rapidly decline and expected benefits turn positive. As a result, many dairy farmers may have elected not to participate based on the seemingly favorable outlook for milk and feed prices which persisted prior to December.
Second, MPP-Dairy is a new program that departs in important ways from the now-expired Milk Income Loss Contract (MILC). MILC was an optional, and no-cost, countercyclical payment program which provided target milk price support. Instead, with MPP-Dairy, farms that sign up are obligated to participate in subsequent years. Thus, it is plausible that uncertainty about program operation and performance lead some farmers to take a wait-and-see approach in 2015. Sign-up rates for the next year of MPP-Dairy may provide some indication of whether this was the case.
References
Newton, J., and M. Bozic. "MPP-Dairy Dashboard: Evaluating Milk Prices Needed to Trigger MPP-Dairy." farmdoc daily (4):214, Department of Agricultural and Consumer Economics, University of Illinois at Urbana-Champaign, November 5, 2014.
Newton, J., and C.S. Thraen. "The Dairy Safety Net Debate Part III: The Compromise Dairy Safety Net Solution." farmdoc daily (4): 26, Department of Agricultural and Consumer Economics, University of Illinois at Urbana-Champaign, February 12, 2014.
Novakovic, A., M. Bozic, M. Stephenson, C. Wolf, C. Nicholson, and J. Newton. "Comments on Summary Enrollment Data for MPP-Dairy." The National Program on Dairy Markets and Policy, Briefing Paper 15-01, January 21, 2015. http://dairymarkets.org/PubPod/Pubs/BP15-01.pdf
United States Department of Agriculture, Farm Service Agency. "State-by-State 2015 Margin Protection Program Enrollment." Accessed online February 10, 2015. http://www.fsa.usda.gov/Internet/FSA_File/mpp_applications_011515.pdf
Notes
[1] For additional comments on MPP-Dairy summary statistics see (Novakovic et al. 2015).
[2] Several farmdoc daily articles review MPP-Dairy program rules including premium rates (e.g. farmdoc daily February 12, 2014 and farmdoc daily November 5, 2014).
[3] Average farm size is calculated as state-level milk production in2013 divided by the number of licensed dairy operations in 2013.
Disclaimer: We request all readers, electronic media and others follow our citation guidelines when re-posting articles from farmdoc daily. Guidelines are available here. The farmdoc daily website falls under University of Illinois copyright and intellectual property rights. For a detailed statement, please see the University of Illinois Copyright Information and Policies here.