


Price Projections and Farm Bill Program Choices: Adding FAPRI-MU Projections to the Mix
A February 4, 2015 farmdoc daily article by Scott Irwin and Darrel Good looked at the historical performance of USDA projections and futures markets in estimating farm prices for corn, soybeans and wheat. This piece adds FAPRI-MU projections to the mix and finds that the three approaches have similar track records. It also provides some additional background on the projections and discusses implications for farm program choices under the 2014 farm bill.
Comparing results
We compiled 10-year FAPRI-MU projections of marketing year average prices for corn, soybeans and wheat going back to 1996. Using the same methodology as in the Irwin and Good article, we computed mean average percentage errors by comparing actual prices to what we had projected 1-10 years previously.
Tables 1-3 summarize the results for corn, soybeans and wheat, respectively. Because the farm bill choices that producers must make depend on price projections for the 2014-18 period, we focus on results for the projections made one to five years in advance. FAPRI-MU projections for the more distant future had larger errors than did projections for the next marketing year, as was the case with USDA estimates.


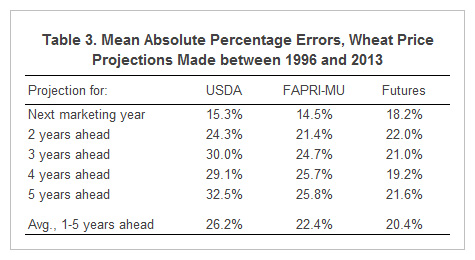
As a producer of long-term projections, it is tempting to cherry-pick results that make FAPRI-MU projections appear favorably (we “beat” futures for corn and USDA for wheat!). The truth is that the errors are very similar across the providers and across commodities. Given the small sample size, it would probably be a mistake to make too much of one or two percentage point difference in the magnitude of the errors.
Are we comparing apples and apples?
There are many ways in which these are not truly fair comparisons. Here are just three:
- Timing. The USDA projections are prepared at the end of the previous calendar year and in the past were published in February (this year, the USDA baseline projections were released in December). The FAPRI-MU projections are prepared in January and released around the first of March most years. The futures contracts used are harvest-time futures on February 1. All else equal, this difference in timing should give at least a small advantage to futures.
- The series. Both USDA and FAPRI-MU project marketing year average prices, so it is fair to compare those two providers. However, the comparisons treat December corn, November soybean, and July wheat futures contracts as equivalent to marketing year average prices. One could argue that some measure of typical basis between futures prices and national average farm prices should be considered, and it might also be useful to look at more than just harvest-time contracts. All else equal, this should put the futures price projections at a bit of a disadvantage in the head-to-head competition.
- The assumptions. If markets are efficient, futures prices should incorporate all available information and provide an unbiased estimate of future prices. The FAPRI-MU baseline is not intended to be a forecast in the usual sense of the word, but rather a projection based on a specific set of assumptions. Most of those assumptions would probably be the same as we might use if all we wanted to do was give an unbiased prediction of future prices. However, because of how our analysis is used in the policy process, our baseline projections generally assume a continuation of current policies, even when we have good reason to think that policies are likely to change in a particular direction and that this could have an impact on future prices. All else equal, this should give at least a small advantage to futures relative to FAPRI-MU projections.
Why make long-term projections?
Some readers are doubtless wondering why we bother to maintain complicated models to do long-term projections if our average performance in estimating future prices is about the same as that available from futures markets. Here are three of many reasons:
- We aren’t just projecting prices for widely traded commodities. Our models cover a broad range of commodities, including some where futures markets are non-existent. Furthermore, we’re not just making projections of prices. We also estimate production, use, trade and stocks of crop and livestock products, as well as indicators ranging from net farm income to consumer food costs to government outlays on farm programs.
- Since the early 2000s, developing point estimates of future market conditions is just one intermediate step in our baseline process. After developing point estimates under a standard set of assumptions, we solve our models 500 times using different assumptions about the weather, energy markets, global demand conditions and much more to generate distributions of possible outcomes for all the prices and other variables that we model. This “stochastic baseline” is the starting point for most of our policy analysis. We recognize the world is an uncertain place, and point estimates often miss the point.
- Although we know our baseline projections get a lot of attention, perhaps the main reason we prepare them is so that we have a reasonable point of comparison when we examine alternative scenarios. For most of the work we do for Congress, for example, the key question is how much difference a policy change will make relative to a baseline. Budgetary estimates by the Congressional Budget Office are all about how much difference a proposed policy change will make in government outlays or tax revenues. The current farm bill is perhaps an extreme example of a case where baselines matter when doing this type of analysis. The estimated fiscal cost of the PLC program would look a lot different, for example, if the baseline suggested future average corn prices would be $5.00 per bushel than if they are $3.00 per bushel.
Thinking about future prices in an uncertain world
In conducting this exercise, we were pleasantly surprised that the year-ahead projection errors from past FAPRI-MU baselines were extremely consistent with our stochastic model results.
For example, in the case of corn, our year-ahead projections were, on average, 15% different than the prices that actually occurred. When we checked the stochastic baseline we released last March, we found that half of our projected outcomes for 2014/15 marketing year corn prices were between $3.56 and $4.66 per bushel. Those estimates of the 25th and 75th percentiles of our price distribution were 15% below and 12% above our average projected price of $4.17 per bushel, respectively. That’s also approximately consistent with the volatility implied by current futures and options prices for corn.
Furthermore, it’s interesting to note that January 2015 USDA projections for 2014/15 corn prices had a mid-point of $3.65 per bushel, near the 25th percentile of our price distribution from last March. At the same time, the USDA-estimated yield of 171 bushels per acre was near the 75th percentile of our projected corn yields. Since prices and yields typically move in opposite directions, if you had told us last spring that we’d have a good growing season in 2014 resulting in a 171 bushel national average corn yield, we probably would have told you to expect a corn price of about $3.65 per bushel. Yet, a simple comparison of our reported average projected price of $4.17 per bushel to the final 2014/15 corn price will suggest a significant forecasting error.
Implications for farm bill choices
Uncertainty about future markets means that it would be a mistake for producers to make a farm bill choice based solely on one assumed future path for prices and yields. That’s why the tool we’ve developed with colleagues at Texas A&M provides estimates of expected payments that result from looking at a range of possible future outcomes for prices and yields. The tool developed by the University of Illinois and its collaborators uses a similar approach. We can and do argue about whether we’ve properly modeled the various distributions and all the correlations, and differences in model results between the two tools can sometimes be attributed to relatively minor differences in these distributions.
So what does this mean for the choices farmers must make? In choosing between ARC-CO and PLC, for example, both tools allow producers to specify a set of average prices to use in conducting the analysis. Especially for a crop like corn, it is very common for the models to give different qualitative results depending on the choice of future average prices. For some farms in some counties, using FAPRI-MU prices may yield results that indicate expected payments for ARC-CO exceed those for PLC, while using USDA prices may result in larger projected payments for PLC. USDA’s December 2014 price projections for corn are lower than the January 2015 FAPRI-MU projections, and the latter were closer to the prices implied by futures markets in early February.
Even though we stand behind our FAPRI-MU projections, which are updated each month during the election period, we encourage producers to check to see how sensitive results are to using different sets of average prices. A message from the comparison of past projection results is that the three providers examined all have about the same record of (in)accuracy in making price projections. If examining results using FAPRI-MU prices, USDA prices and prices consistent with futures markets all yield the same qualitative results, producers can feel more confident that they are making a reasonable choice.
If the results differ across price assumptions or across tools, it’s probably a good indication that producers may want to think about more than just trying to identify the choice that will maximize future payments. What keeps you up at night? Owners and renters may have different concerns, as may those in stronger or weaker financial positions.
As suggested by Carl Zulauf in a farmdoc daily piece and others, producers operating more than one FSA farm may want to diversify their program choices, perhaps choosing PLC for a farm where they have a high program yield and ARC-CO for a farm with a lower program yield. This makes the most sense if the tools indicate it may be a close call among the program options, and could be of special relevance to producers who could face payment limitation issues if picking the “right” program across all farms results in large payments in a year with low prices or revenues.
Final comment
At a conference in Manhattan, Kansas last week, Mike Scherer of Ag Risk Solutions used an apt analogy. Suppose someone asks you to bet on the roll of a dice. If you pick the first option, you win if the dice comes up with a one or a two. Under the second option, you win if the dice comes up with a three, four, five or six. Most people would probably choose the second option if the promised payout was the same for either choice.
Suppose now that the dice is rolled and it comes up a two. Did you make the wrong choice?
The same logic applies to the farm program choice. We may not know until the fall of 2019 what will be the farm program choice for a given crop on a given farm that maximizes payments. The whole point of the tools is to help producers understand the risks they face and to shift the odds, at least a little bit, in their favor.
Acknowledgements
Thanks to Scott Irwin and Darrel Good for sharing their data set comparing USDA projections, futures prices and marketing year average prices. Thanks also to Scott Gerlt for comments on an earlier draft of this article and to Malinda Foster for compiling past FAPRI-MU projections.
References
Food and Agricultural Policy Research Institute at the University of Missouri (FAPRI-MU). "U.S. Baseline Briefing Book: Projections for Agricultural and Biofuel Markets." FAPRI-MU Report 02-14, Columbia, Missouri, March 2014 and corresponding issues for previous years. http://www.fapri.missouri.edu/outreach/publications/2014/FAPRI_MU_Report_02_14.pdf
Irwin, S., and D. Good. "Long-Term Corn, Soybeans, and Wheat Price Forecasts and the Farm Bill Program Choice." farmdoc daily (5):20, Department of Agricultural and Consumer Economics, University of Illinois at Urbana-Champaign, February 4, 2015.
National Association for Agricultural and Food Policy. "NAAFP Farm Bill Decision Aid." Accessible from the Agricultural and Food Policy Center (https://usda.afpc.tamu.edu/) and FAPRI-MU (www.fapri.missouri.edu) websites.
Zulauf, C. "The Case for Considering the Diversification of Crop Program Choice for a Crop." farmdoc daily (5):22, Department of Agricultural and Consumer Economics, University of Illinois at Urbana-Champaign, February 6, 2015.
Disclaimer: We request all readers, electronic media and others follow our citation guidelines when re-posting articles from farmdoc daily. Guidelines are available here. The farmdoc daily website falls under University of Illinois copyright and intellectual property rights. For a detailed statement, please see the University of Illinois Copyright Information and Policies here.