


Crop Insurance Loss Performance in 2014
Most payments on 2014 crop insurance policies have been entered into the Summary of Business, a database administered by the Risk Management Agency (RMA). Given relatively complete payment data, an assessment of 2014 loss performance can be made. Overall, loss performance was near “average” when judged relative to the 10-year average loss ratio. In most counties, payments did not exceed total premium. Notable areas of higher losses occurred in 1) western Oklahoma and northwestern Texas and 2) northern Iowa and Minnesota.
Overall Crop Insurance Performance
In 2014, 294.6 million acres were insured using crop insurance policies administered by RMA, an agency within the U.S. Department of Agriculture. Total premium on these policies were $10,061 million, and premium paid out were $9,029 million.
A useful method for evaluating loss performance is to compute loss ratios. A loss ratio equals insurance payments divided by total premium. For 2014, the loss ratio across all RMA-administered policies is .90 ($9,029 million in insurance payments / $10,061 million in total premium). RMA has a statutory goal of maintaining a loss ratio near 1.00 over time, meaning that insurance payments should be near total premium. Loss ratios below 1.00 mean than payments were less than total premium. Conversely, loss ratios above 1.00 mean than payment exceed total premium
Loss ratios vary across time depending on the size and severity of adverse events that cause crop insurance payments. During the last ten years, loss ratios on all RMA-administered products ranged from a low of .54 in 2007 to a high of 1.62 in 2012 (see Figure 1). The high ratio was associated with the 2012 drought, which had its largest impacts in the eastern Corn Belt, Missouri, and eastern Kansas. The average loss ratio over the ten years was .83. Overall, 2014 loss ratio of .90 was slightly above average, but not out of the ordinary.

Performance by Crop
Loss performance varied across crops in 2014. Table 1 shows performance for the ten crops with the largest total premium. Corn had $3,648 million in total premium, accounting for 36% of total premium. The next three largest crops were soybeans (22% of total premium), wheat (14%), and cotton (7%). These four crops accounted for 79% of total premium in 2014.
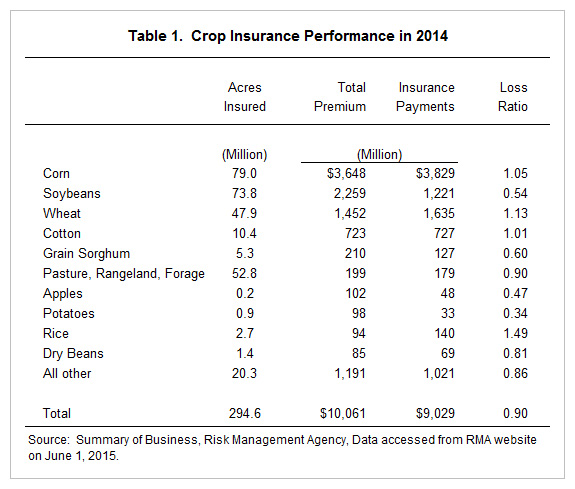
Corn’s loss ratio in 2014 was 1.05, indicating that $3,829 of insurance payments exceeded the $3,648 million in total premium. Soybeans, wheat, and cotton has loss ratios of .54, 1.13, and 1.01, respectively. Of the ten largest-premium crops, the crop with the lowest loss ratio was potatoes (.34 loss ratio) and the crop with the highest was rice (1.49). Overall, loss ratios by crop did not approach historic highs. Several crops had yearly loss ratios above 2.00 in the last ten years.
Performance by Geography
Figure 2 shows a map of loss ratios by county. These 2014 loss ratios are aggregated across crop and are weighted by total premium. Most counties in the United States had loss ratios below 1.00 in 2014. Counties with loss ratios above 1.00 occur sporadically across the United States, with notable concentrations of high loss ratios in two areas:
- Western Oklahoma and northwestern Texas. Insurance payments on wheat were significant in this area.
- Northern Iowa and Minnesota. Losses on corn and soybean policies led to high loss ratios.
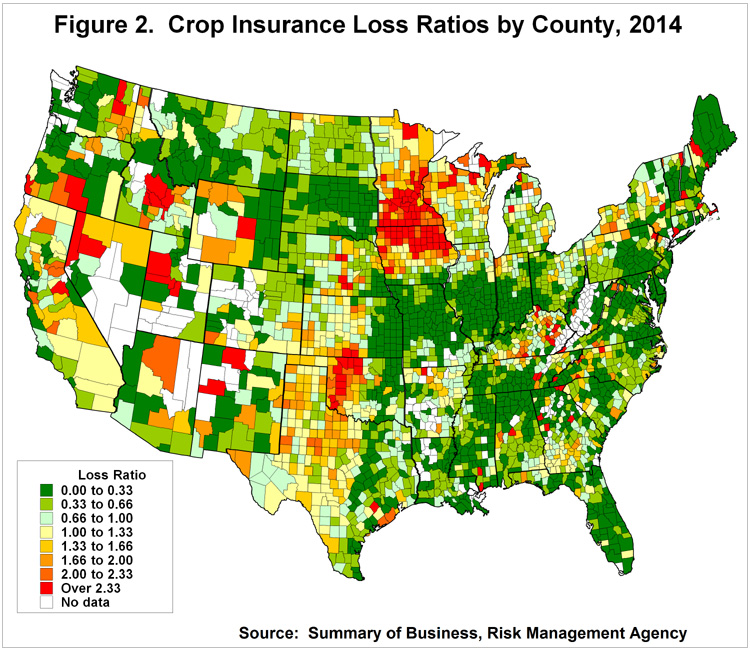
Notable differences in loss performance existed in the Midwest. Very low loss ratios existed from eastern Kansas, Missouri, the southern two-thirds of Illinois and Indiana, to western Ohio. Low loss ratios also occurred in South and North Dakota. Exceptional yields in these areas led to low insurance payments. In contrast, counties in the northern two-thirds of Iowa and Minnesota had loss ratios above 1.0, with many counties having loss ratios above 2.00. In these areas, revenue products made payment as harvest prices were below projected prices and yield increases did not counter price declines.
Summary
Overall, 2014 was near average in terms of crop insurance performance. Insurance payments were less than total payments, and the loss ratio across crops was .90. Most counties had loss ratios below 1.00. Two areas of higher loss ratios were in 1) western Oklahoma and northwestern Texas and 2) northern Iowa and Minnesota.
Disclaimer: We request all readers, electronic media and others follow our citation guidelines when re-posting articles from farmdoc daily. Guidelines are available here. The farmdoc daily website falls under University of Illinois copyright and intellectual property rights. For a detailed statement, please see the University of Illinois Copyright Information and Policies here.