


China and the World’s Increasing Need for Cropland
This article examines China’s role in the World’s increasing need for additional land to grow feed grains, oilseeds, and food grains (see farmdoc daily November 16, 2022). Roughly 8 million more acres are needed each year to satisfy China’s increasing consumption of these crops, or about 50% of the additional land needed by the World each year. China’s share has fluctuated around 50% since the mid-1990s. China is thus an important but not the only reason for the World’s increasing need for more cropland.
Data
The data in this article are from the Production, Supply, and Distribution Online database managed by the US Department of Agriculture, Foreign Agriculture Service. To provide comparability with the November 16, 2022 farmdoc daily, the analysis begins with the 1981/1982 crop year.
Consumption
Since 1980, China’s domestic consumption of feed grains and oilseeds plus its exports of these crops has followed a 2nd degree polynomial time trend (i.e. linear and squared time variables) (see Figure 1 and Data Notes 1 and 2). Total use of these crops has increased with the amount of increase growing each year. Use of wheat has also grown but its year-over-year growth has been linear. Exports by China are currently small. For 2022, exports as a share of domestic consumption plus exports are projected to be 0.02% for feed grains, 0.54% for oilseeds, and 1.02% for food grains.

Yield
China’s yield, measured in metric tons per hectare, has increased in a constant linear trend for oilseeds and food grains (see Figure 2 and Data Note 3). The increase in trend yield of feed grains has increased slightly over time and thus has followed a curvilinear trend. Each of these time trend models explains over 95% of the annual variation in China’s yield (100% is a perfect fit).

Consumption – Yield Gap
Figures 3, 4, and 5 contain the time path since 1980 of the year-to-year increase in trend consumption by China of feed grains, oilseeds, and food grains, respectively. The time paths are derived from the equations in Figure 1. Figures 3-5 also contain each year’s increase in China’s production resulting solely from the increase in China’s trend yield. Harvested area is assumed to remain the same as in the previous year. Each year’s increase in trend yield is derived from the equations in Figure 2. Data Note 4 contains an example of these two calculations.

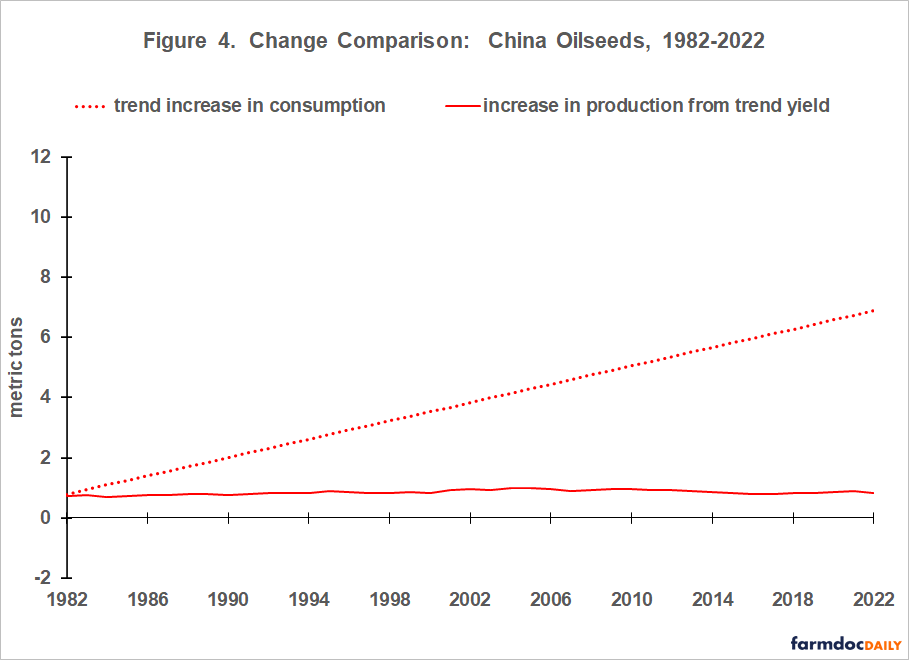

For feed grains, China’s increasing yield stopped covering its increasing consumption of feed grains in 1994 (see Figure 3). For oilseeds, China’s increasing yield has not kept pace with its increasing consumption of oilseeds since the early 1980s (see Figure 4). For food grains, China’s increasing yield has allowed it to cover its increasing consumption of food grains throughout the study period (see Figure 5).
Harvested Land
The difference between the trend increase in consumption and the increase in production from higher trend yields in Figures 3-5 can be converted into harvested area for a year by dividing the difference by that year’s trend yield. More land is needed if consumption is increasing faster than production from increases in trend yield. Less land is needed if consumption is increasing less than production from increases in trend yield.
This calculation is made for both China and the World in order to assess China’s role. The trend consumption and trend yield equations used to make the calculations for the World are discussed in the November 16, 2022 farmdoc daily. China’s trend yield is used in the calculations for China food grains since China is a small net exporter of food grains. World trend yield is used for China feed grains and oilseeds since China imports these crops. World trend yield is used for World feed grains, oilseeds, and food grains. Data Note 5 contains an example of the calculation.
Since 1990, more land has been needed to meet China’s and the World’s growing consumption of feed grains, oilseeds, and food grains in total (see Figures 6 and 7). Moreover, the amount of additional land needed has increased steadily over time.


In 2022, China’s need for 8.3 million additional acres of feed grains, oilseeds, and food grains was 51% of the world’s need for 16.2 million additional acres of these crops (see Data Note 6). China’s share of the World’s additional needed acres has fluctuated around 50% since 1993.
Oilseeds play a key role. In 2022, they accounted for 74% of all additional land needed for China and 56% of all additional land needed for the World. The prominent role of oilseeds is likely related to the interaction of a smaller increase in yield (see Figure 2) with growing consumption of animal proteins.
Summary
Increases in yields have not kept pace with China’s increasing consumption of feed grains and oilseeds, thus necessitating the need for more land.
Based on historical time trends, China now needs roughly 8 million more acres per year to satisfy its growing consumption of feed grains, oilseeds, and food grains.
The World now needs roughly 16 million more acres per year to satisfy its growing consumption of feed grains, oilseeds, and food grains, implying China’s share of needed additional World acres is roughly 50%. China’s share of additional World acres has fluctuated around 50% since the mid-1990s.
The preceding point implies that China is an important but not the only reason for the World’s growing need for more land to produce feed grains, oilseeds, and food grains. The World’s increasing need for additional cropland is more than a “China phenomenon.”
To put the need for additional land in a US perspective, the World needs to roughly add an area equal to the 46.7 million principal crop acres in Illinois and Iowa every three years, with China’s consumption needing half these acres or, roughly, the principal crop acres in either Illinois or Iowa every three years.
Data Notes
- Feed grains are barley, corn, millet, oats, and sorghum. Oilseeds are cottonseed, peanuts, rapeseed, soybeans, and sunflowers. Food grains are rice, rye, and wheat.
- R2 of the 2nd degree polynomial and linear (in parenthesis) regressions of China’s use is 98.7% (91.2%) for feed grains, 98.6% (94.3%) for oilseeds, and 81.8% (81.8%) for food grains. The higher R2 for the 2nd degree polynomial for feed grains and oilseeds is 99% statistically confident.
- R2 of the 2nd degree polynomial and linear (in parenthesis) regressions of China’s yield is 95.3% (94.7%) for feed grains, 97.4% (97.4%) for oilseeds, and 97.5% (97.5%) for food grains. The higher R2 for the 2nd degree polynomial for feed grains is 95% statistically confident.
- Example: Using the equation in Figure 1 for China’s consumption of food grains, trend consumption of food grains increased by 2.1 million metric tons between 2021 and 2022, from 282.7 to 284.8 million metric tons. China’s production of food grains is projected to increase by 3.1 million metric tons between 2021 and 2002 based on the historical increase in its food grain yield of 0.058 metric tons per hectare (from the food grain equation in Figure 2) times the 53.5 million hectares of food grains harvested in 2021. China is expected to need fewer acres of food grains in 2022 than 2021 since the increase in production from a higher trend yield (3.1 million metric tons) exceeds the historical trend increase in China’s consumption of food grains (2.1 million metric tons).
- Example: Continuing with the example in Data Note 4, the increase in China’s food grain production from its increasing trend yield exceeds the increase in its consumption by 1.0 million metric ton. Dividing 1.0 million metric ton by China’s estimated trend food grain yield in 2022 of 5.4 metric tons / hectare (derived from Figure 2’s food grain equation) finds that China can harvest -0.185 million fewer hectares of food grains in 2022 and still meet its 2022 trend consumption. Multiplying -0.185 hectares by 2.47105 acres / hectare gives a need for -0.46 million fewer harvested acres of food grains in China in 2022 vs. 2021.
- The November 16, 2022 farmdoc daily contained an estimate of 22 million more acres each year needed by the World. It was derived using a different method: the average 0.9% increase per year since 2002 in World harvested feed grain, oilseed, plus food grain land multiplied by land harvested in 2022. This article’s lower estimate is likely due in part to the explicit incorporation of yield trends. Yields are trending higher, thus lowering the need for additional land in future years.
References and Data Sources
US Department of Agriculture, Foreign Agriculture Service. Production, Supply, and Distribution Online, October 2022. https://apps.fas.usda.gov/psdonline/
Zulauf, C. “The World’s Increasing Need for Cropped Land.” farmdoc daily (12):173, Department of Agricultural and Consumer Economics, University of Illinois at Urbana-Champaign, November 16, 2022.
Disclaimer: We request all readers, electronic media and others follow our citation guidelines when re-posting articles from farmdoc daily. Guidelines are available here. The farmdoc daily website falls under University of Illinois copyright and intellectual property rights. For a detailed statement, please see the University of Illinois Copyright Information and Policies here.