


2021 Commodity Program Payment Dashboard
ARC (Agriculture Risk Coverage) and PLC (Price Loss Coverage) commodity program payments for the 2021 crop year are discussed (see Data Note). They were recently released by USDA, FSA (US Department of Agriculture, Farm Service Agency). Payments were limited with high prices a key reason. However, the outcome of decisions by farmers also was a reason. PLC made higher average payments per base acre for only 4 of the 22 program commodities that farmers had put more base acres into PLC. ARC-CO (ARC-county version) acted as a standing disaster assistance program as its payments were largely made to counties with below, often much below, trendline yield. The preceding prompts a policy question, “Should the role of ARC-CO as a standing disaster assistance program be enhanced in the next farm bill?”
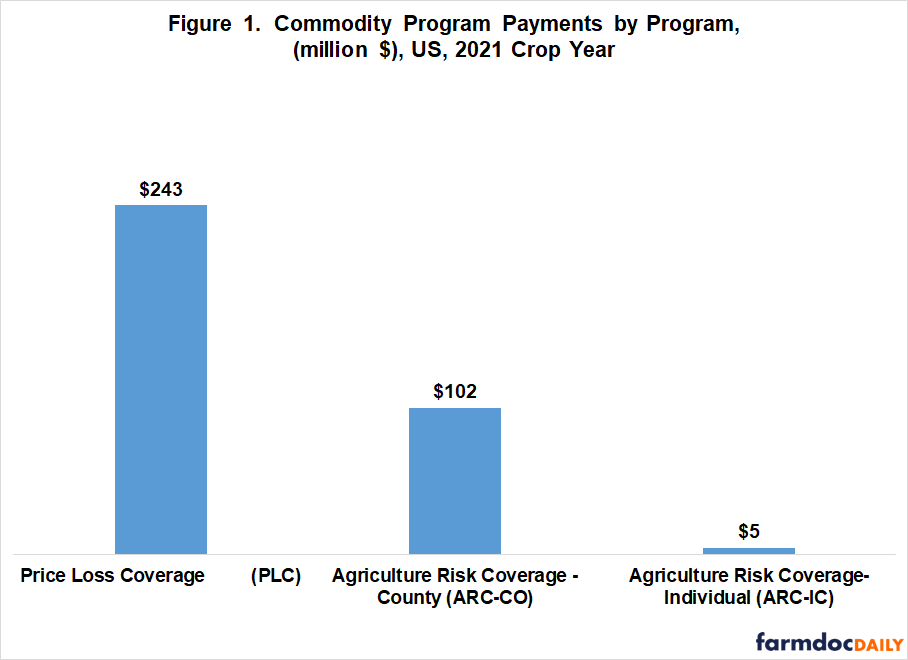
Commodity Payments: Commodity program payments totaled $349 million. Share by PLC, ARC-CO, and ARC-IC (ARC – individual farm) was 70%, 28%, and 2%, respectively (see Figure 1).
Payment by State: Seven of the 10 states receiving the most commodity payments are in the South (see Figure 2). PLC made 99% of payments in 6 of them and 86% of payments in Texas. Collectively, these 7 states accounted for 86% of PLC payments. The other 3 states in the top 10 are in the Northern Plains. ARC-CO accounted for over 90% of their payments.

Payment by Covered Commodity: Peanuts and long-grain rice accounted for 48% and 22%, respectively, of all commodity program payments (see Figure 3). Nearly all their payments were from PLC. Georgia, which received the most commodity payments, is the leading producer of peanuts and has 40% of US peanut base acres. Leading producer of long-grain rice is Arkansas. It has 48% of US long-grain rice base. Roughly 20% of US peanut base and 13% of long-grain rice base are in Texas, which received the second most commodity payments. The only other program commodities to receive payments from PLC were rapeseed and medium / short grain rice).

ARC-CO made payments to all 23 program commodities and all payments to 19 program commodities, including the other 8 crops in Figure 3. Because of high prices, ARC-CO payments were limited to counties with yields that were well below trendline. To provide perspective on ARC-CO payments for yield loss, the state with highest average ARC-CO payment per ARC-CO base acre was identified for the 8 crops. The state must have had at least 25,000 base acres in ARC-CO. Payment to 4 of the 8 state – program commodity observations averaged $13 or more per ARC-CO base acre. Payment will be higher in each state for the county with the highest ARC-CO payment per ARC-CO base acre (FSA has not released payments by county). In summary, ARC-CO provided meaningful payments for the 2021 crop year that could help mitigate potential financial stress due to low yields.

Performance of Decision Indicator: A simple decision indicator for the upcoming crop year commodity program decision has been discussed in the December 9, 2021, February 24, 2022, and February 20, 2023 farmdoc dailies. Specifically, for the upcoming program crop year decision, the December US cash price for the current crop year is compared to the effective reference price for the next crop year. If the December cash price is higher, ARC-CO is expected to pay more per base acre. If the effective reference price is higher, PLC is expected to pay more per base acre.
The comparison for the 2021 crop year decision involved the December 2020 US cash price and 2021 crop year effective reference price. For the 18 program commodities that the indicator could have been calculated in February 2021, it correctly predicted for all 18 program commodities whether ARC-CO or PLC would end up paying the most per base acre for the 2021 crop program year (see Table 1). The indicator could not be calculated for 5 program commodities: crambe, mustard, rapeseed, safflower, and sesame. USDA, NASS (National Agricultural Statistics Service) does not report a US cash price for them. Note, the decision indicator was computed before the 2021 program decision deadline of March 15, 2021. It is thus a real time, forward looking prediction indicator.

For all crop years from 2014 through 2021, the decision indicator has been 84% accurate in predicting if ARC-CO or PLC ended up making the higher average US payment per base acre for the year.
Decision Performance of Farmers: Farmers as a group elected more base acres into the program with the higher average payment per base acre for only 5 of the 23 program commodities (see Table 2). More base acres were in PLC than ARC-CO for every program commodity except soybeans. PLC made the higher average payment per base acre for 4 of them.

Discussion
The December US cash price – effective reference price indicator for the 2021 ARC-CO vs. PLC decision correctly predicted which one would on average pay more per base acre for the 18 crops that it could be calculated. Past performance does not guarantee future performance, but farmers and their advisors may want to keep the indicator in mind if the new farm bill retains the ARC-CO vs. PLC decision.
Commodity program payments for the 2021 crop year were limited. High prices were a key reason. But, also contributing was the outcome of decisions by farmers. PLC made higher average payments per base acre for only 4 of the 22 program commodities that farmers had put more base acres into PLC.
ARC-CO functioned as a standing disaster assistance program for the 2021 crop year. Because prices were high, it made payments only to countries with below, often much below, trend yields.
ARC-CO’s role as a standing disaster assistance program has received little attention, but recent interest in standing disaster assistance prompts the question, “Should the farm bill consider enhancing the role of ARC-CO as a standing disaster assistance program?”
As an example of potential policy adjustments, should the 10% cap on ARC-CO payments be increased or eliminated altogether when ARC-CO payments are clearly based on low yields? Or, should coverage be increased above 86%, perhaps using a graduated coverage scale with coverage level increasing the more market price exceeds the effective reference price?
Data Note
Dashboards for 2019 and 2020 crop year commodity payments are available in the farmdoc dailies of February 18, 2021 and January 13, 2022.
References and Data Sources
US Department of Agriculture, Farm Service Agency. January 2022. “ARC/PLC Program Data – Non-Program Year Specific Data.” https://www.fsa.usda.gov/programs-and-services/arcplc_program/arcplc-program-data/index
Zulauf, C., G. Schnitkey, K. Swanson and N. Paulson. “2020 Commodity Program Payment Dashboard.” farmdoc daily (12):6, Department of Agricultural and Consumer Economics, University of Illinois at Urbana-Champaign, January 13, 2022.
Zulauf, C., G. Schnitkey, K. Swanson and N. Paulson. “2022 Commodity Program Decision: ARC-CO – PLC Decision Indicator.” farmdoc daily (12):25, Department of Agricultural and Consumer Economics, University of Illinois at Urbana-Champaign, February 24, 2022.
Zulauf, C., G. Schnitkey, K. Swanson and N. Paulson. “Does December Cash Price Help Predict If ARC-CO or PLC Pays More Next Year?” farmdoc daily (11):164, Department of Agricultural and Consumer Economics, University of Illinois at Urbana-Champaign, December 9, 2021.
Zulauf, C., G. Schnitkey, K. Swanson, N. Paulson and J. Coppess. “2019 Covered Commodity Dashboard and Implications for the Crop Safety Net.” farmdoc daily (11):25, Department of Agricultural and Consumer Economics, University of Illinois at Urbana-Champaign, February 18, 2021.
Zulauf, C., N. Paulson and G. Schnitkey. “2023 ARC-CO vs. PLC Program Decision Indicator.” farmdoc daily (13):30, Department of Agricultural and Consumer Economics, University of Illinois at Urbana-Champaign, February 20, 2023.
Disclaimer: We request all readers, electronic media and others follow our citation guidelines when re-posting articles from farmdoc daily. Guidelines are available here. The farmdoc daily website falls under University of Illinois copyright and intellectual property rights. For a detailed statement, please see the University of Illinois Copyright Information and Policies here.